As some may know I’ve had an interest in technology for maths for quite some time now. Because of this I am very aware of what the developments are. One of the latest offering from the wonderful online graphing calculator from Desmos, consists of their ‘activities’. Although every maths teacher should stay critical with regard to integrating ‘as is’ activities in their classrooms, I also think they should be aware of this fairly new feature. That is the reason I flagged it up during some ‘maths and technology’ sessions I ran for the maths PGCE. But always as critical consumers.
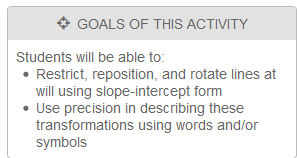
One of the latest offerings is the Marbleslides activities. I first read about it on Dan Meyer’s blog. There are several version of it, with linear functions, parabolas and more. As always the software is slick and there is no doubt the ‘marble effect’ is pretty neat. It reminds me of a combination of ‘Shooting balls‘ (linear functions, Freudenthal Institute, progressive tasks), ‘ Green globs‘ (functions through the globs) and also the gravity aspects of Cinderella. It has already been possible to author series of tasks with the latter widget. I first tried the ‘marbleslide-lines‘. The goals of the activity are:

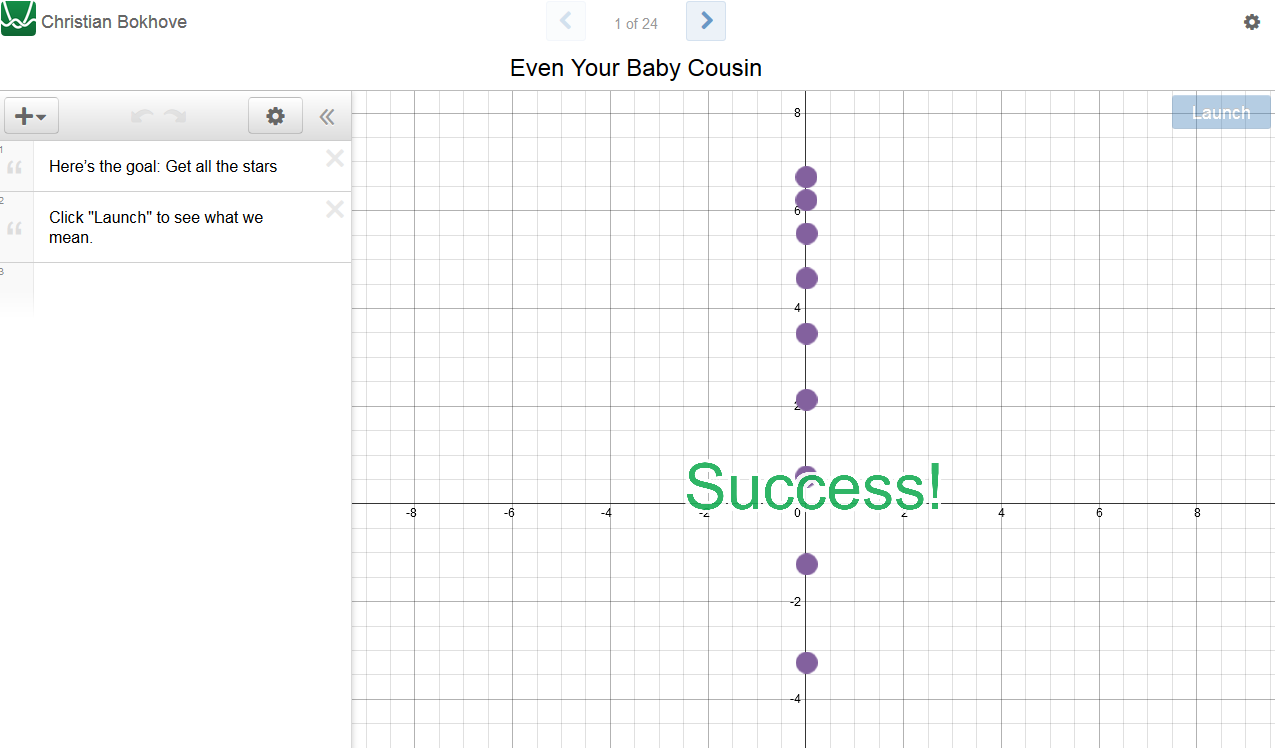
The activity starts off with some instruction on the use of it. Many questions arise:
- Why do the marbles start at (0,7) ?
- Are the centers of the starts ‘points’? (this becomes important later on)
- Why several marbles? Why not one?
- Why do the marbles have gravity?
- How much gravity is it? 9.8 m/s^2?
Clicking launch will make the marbles fall and because they fall through the stars ‘success’ is indicated.

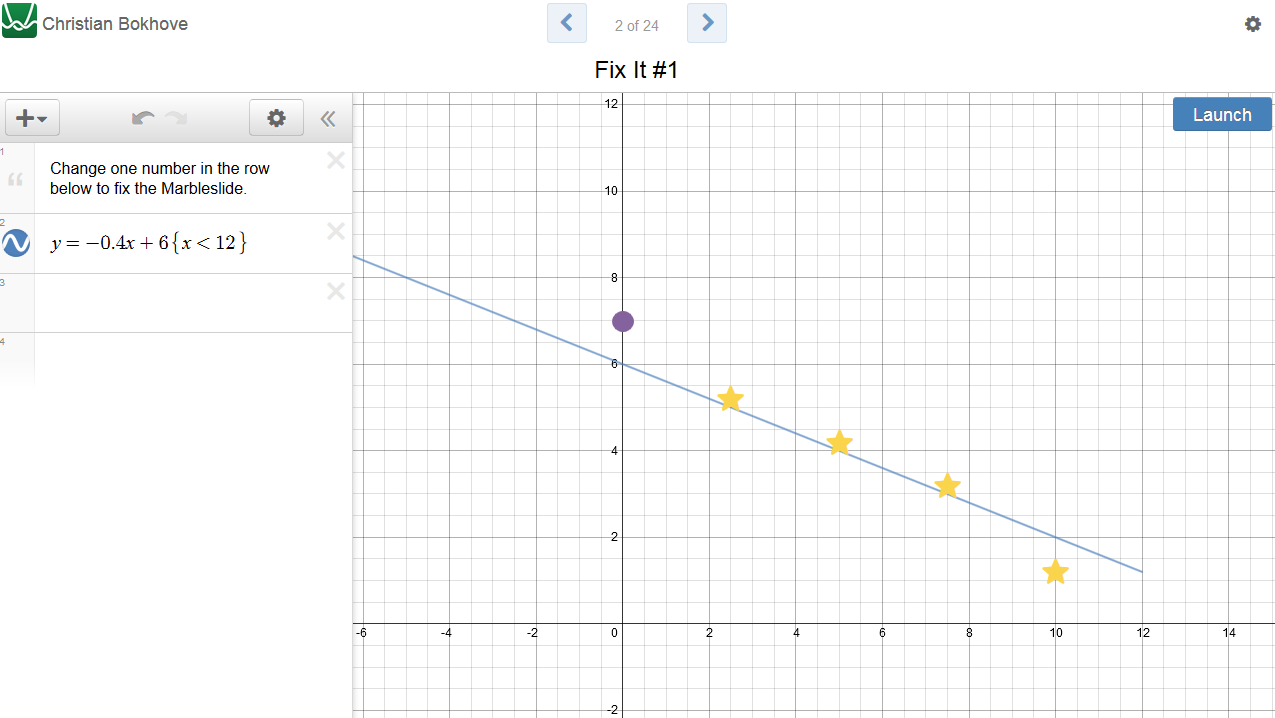
I am already thinking: so is the point to get through the points or the stars? And if gravity is at play, does that mean lines do not extend upwards? Any way, I continue to the second page, where I need to fix something. What is noticeable is 1. yes, the marbles again are at (0,7), 2. the line has a restricted domain, 3. the star to the right is ‘off line’. I’m not much more informed about the coordinates of the star, which leads me to assume they don’t really matter: it must be about collecting them. ‘Launching’ shows the marbles only picking up only two of the stars (for movie, see here).
 The line has to be extended. The instruction is “change one number in the row below to fix the marble slide”. A couple of things here: what is there to fix? Is something really broken? The formula has a domain restriction. Do we really want to use the terminology of this domain being broken? I removed the domain restriction. This is ‘just’ a normal line. But it doesn’t give all the stars so ‘no success’. Restricted to x<12 no. For x<9 marbles shoot over. x<7 and there is success.
 This is very much trial and error, partly caused by the gravity aspect.
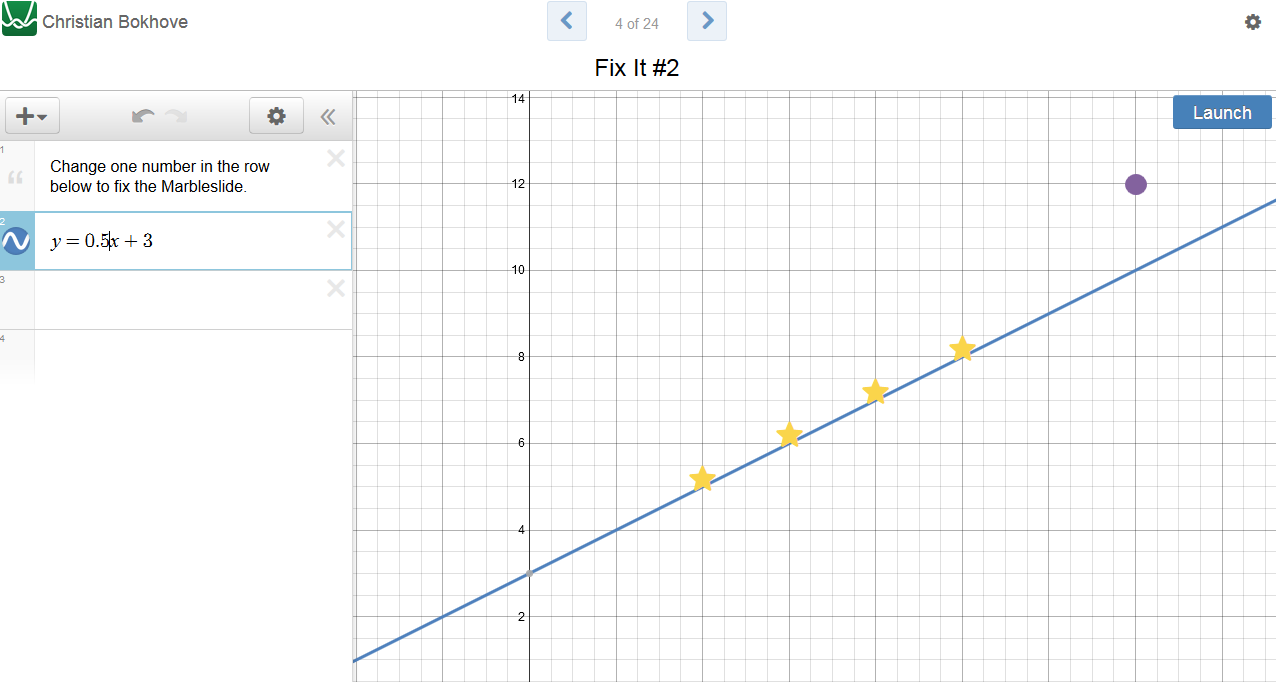
On page 4 there is a more conventional approach: there is a line with a slope. The prior knowledge indicated in the notes mentions y=mx+b should be known: “Students who know a little something about domain, range, and slope-intercept form for lines (y=mx+b)”. I wonder why this terminology is not used then. Again the formulation of the task is “change one number in the row below to fix the marble slide”.
 Because it’s relatively conventional I guess the slope is meant. But am I meant to guesstimate? Or use the coordinates? Does it matter? I first tried 1 (yes, I know that’s incorrect) and I just keep on adjusting.

0.5 seems ok, but 0.45 is ok as well, even 0.43. 0.56 does as well, but 0.57 misses a star because the line runs above it. May I adjust the intercept? I can, so this again promotes trial and error over thinking beforehand, in my opinion. In addition, it does not instill precision.
On page 5 the same thing but now for the intercept.
 I’m still curious why the terminology of y=mx+b isn’t used. I guess -2 is expected as nicest fit but I can go as far as -2.7 to get ‘success’, yet -1.4 is ‘no success’. This could be seen by the teacher, of course (well, we can make any confusion into an interesting discussion, of course). It is interesting to see the marbles now start from higher up, by the way. The gravity question becomes more pertinent. How much gravity? And there is a bounce, surely the bounce is more if the gravity or hight is greater? Or not? Apart from the neat animation, what does it add?
Then on page 6 we go to stars that are not on one line (surely too quick?). There again are several answers, which in my opinion keeps on feeding the idea that points (but sure, they are stars) do not uniquely define a line.
 From page 7 predictions are asked when numbers are changed. There still is no sign of terminology. It is a nice feature that the complete Desmos tool can then be used to check the answers. This is about functions, unlike the marbles section. Why is the domain still restricted, though? Throughout the tasks it seems as if domain and range are modified to suit the task, rather than a property of functions. Granted, a small attempt to address it is in page 11.
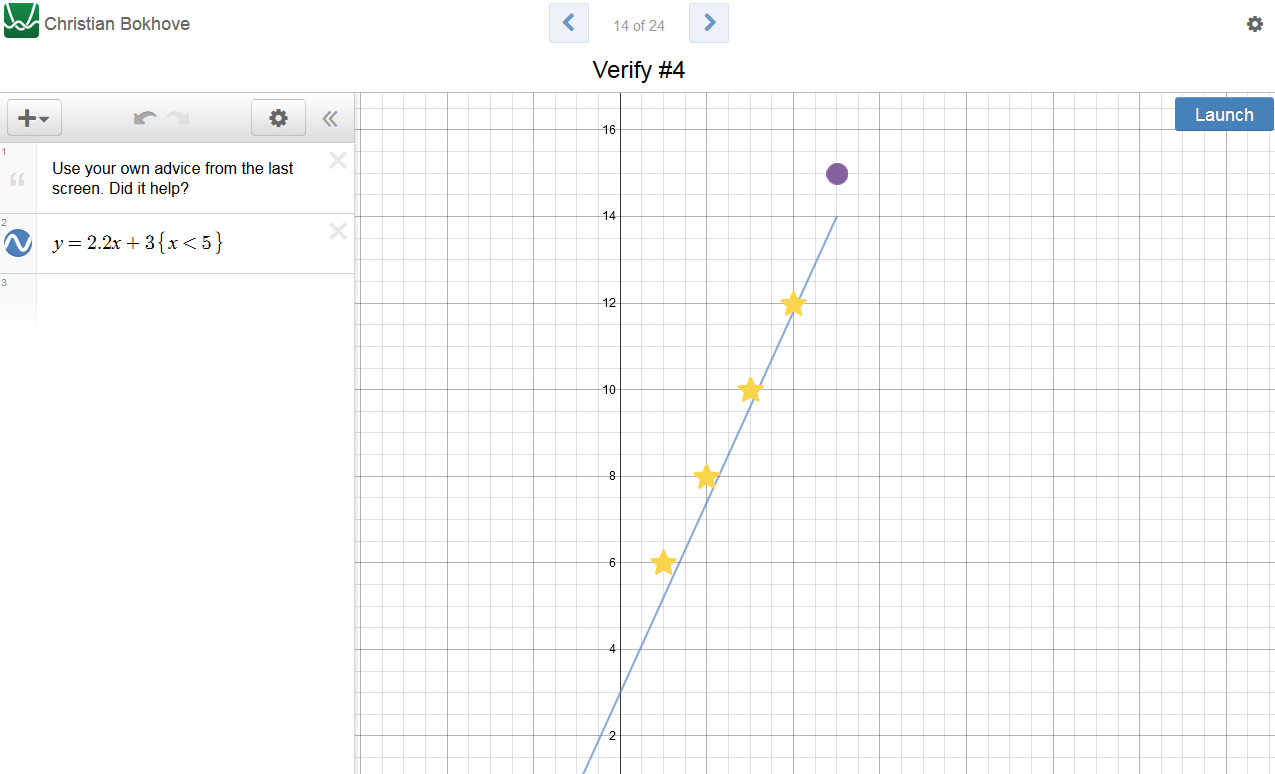
On page 13 the stars are back again. The first attempt with whole numbers is exactly right y=2x+4{x<5}. Some marbles fell to the right of the line though. Nevertheless, there was ‘success’. But there also was success on page 14 like this:
 From page 15 there are challenges. The instruction says to “Try to complete them with ONLY linear equations and as FEW linear equations as possible.” These are a lot of fun, but I struggle to see the link to slope-intercept form y=mx+b. It is not mentioned explicitly. There is no real attempt to link to the terminology. I fear it will remain a fun activity with a lot of creative trial and error.
 I’ve also looked at the parabolas activity. The same features are apparent here: functions are collections of points (rather: stars) and functions have to be found that go through them. The assertion is that transformations of graphs are somewhat addressed concurrently, but the trial and error aspect makes me doubt this. It also deters from general properties of graphs like roots, symmetry, minimums, maximums. I can see a role for playful estimates but in my opinion they must be anchored in proper terminology, precision and properties of graphs. Furthermore, I was inclined to sometimes just use lines. There was no feedback as how this was not permitted. One could even say a line also is polynomial, so why wouldn’t I. The trial-and-error nature might further incentivise these creative solutions. Great, of course, if you know transformations already but not if the activities are meant to strengthen skills and understanding (did I ever say they go hand in hand? 🙂
Some of these aspects might be mitigated by the editing feature that will be released soon, but surely not all answers to fundamental but friendly critique will be “do it yourself”? Another nice feature of course, also in other software, is that you can see student work. Yet I feel with some of these fundamental issues not properly addressed, misconceptions might arise. I think that the marble animation is at risk of obfuscating what the tasks should be about. It might lead to more engagement (fun!) but if it does not lead to learning or even might lead to misconceptions, is that helpful? Firstly, I think the scaffolding of tasks should be more extensive with a clear link to maths content. Secondly, I would reconsider the confusion between ‘points on a line’ and ‘stars to collect’. I hope Desmos can iron out some of these issues, because one thing is sure: the falling marble effect remains a joy to behold. However, pedagogically, I think as it stands it needs to be developed further.