Categories
Education Research Research

Transcribing audio with less pain

forblogLike so many people I’ve never really liked transcribing audio, for example from interviews or focus groups. It is time-consuming and boring. Of course, you can outsource this but that unfortunately costs money. So I thought: “how can I do this quicker with available services.”

Last year with a colleague I wrote an article on exactly this: using the Youtube auto-captioning feature to more quickly transcribe audio. The quality of Youtube’s voice recognition has improved considerably in the last decade. The paper gives three examples, from interview audio, a classroom recording, and a Chilcott inquiry interview to show how useful this can be for transcribing audio ‘as a first transcript version’. I just posted the pre-publication.

DOWNLOAD PRE-PUBLICATIONS

To demonstrate the procedure, I applied it to my recent podcast with TES.

  1. You first need to get hold of an audio file. I assume you have it from your data collection. Sometimes you can obtain them like using apps in the browser like DownThemAll! (that one is for Firefox),
  2. Before being able to upload to Youtube, you need to make a video file out of it. For windows, I prefer Movie Maker. Unfortunately this has been discontinued, but you can still find it here. I make a video with an image and the audio as accompanying sound.
  3. Now this ‘movie’ (actually audio with one image) can be uploaded to Youtube. After a few hours Youtube should have created closed captions for the audio. Ensure that privacy settings are set correctly.
  4. The captions can be downloaded as text file via multiple tools like DIY captions or downsub. Some software is non-web-browser based, and some can also work with private settings (just as long as you are the ‘owner’ of the file, of course). The result might be a subtitle file, which could further be edited with subtitle software.
  5. You can see that this version already is pretty good. I think it captures it for around 80%. It took maybe 15 minutes of actual labour and some time for the Youtube captioning to do its work, for a 40 minute audio file.  This saves me a lot of time.
Categories
Education Research Math Education Research Statistical Methods

Presentation ICME13

This is the presentation I gave at ICME-13:

OPPORTUNITY TO LEARN maths: A curriculum approach with timss 2011 data
Christian Bokhove
University of Southampton

Previous studies have shown that socioeconomic status (SES) and ‘opportunity to learn’ (OTL), which can be typified as ‘curriculum content covered’, are significant predictors of students’ mathematics achievement. Seeing OTL as curriculum variable, this paper explores multilevel models (students in classrooms in countries) and appropriate classroom (teacher) level variables to examine SES and OTL in relation to mathematics achievement in the 2011 Trends in International Mathematics and Science Study (TIMSS 2011), with OTL operationalised in several distinct ways.  Results suggest that the combination of SES and OTL explains a considerable amount of variance at the classroom and country level, but that this is not caused by country level OTL after accounting for SES.

Full paper, slides:

Categories
Education Research Research Statistical Methods

Costs and Benefits of Initial Teacher Training Routes

Only recently did i manage to read the November 2014 report published by the Institute of Fiscal Studies (but joint with the Institute of Education and NFER, funded by Nuffield) on the Costs and Benefits of Different Initial Teacher Training Routes. It is an interesting read; it would go too far to comment on all of the content, but it was striking that different media outlets chose different ‘slants’ on the report.

IFS had quite an extensive press release highlighting several aspects, while the NFER chose three of the findings. The report is an interim report from a Nuffield project (I noticed Nuffield funds the IFS for more ‘public spending’ projects).

It is fascinating to see how outsiders reported or blogged about the results. John Howson seems to emphasize the monetarization and quantification of ITT routes. I agree with him that this could turn into an issue: it’s shouldn’t solely be about numbers. However, for public justification of expenses in principle it is important to explain how public money is spent. The Public Finance website had quite a factual report, and among other points, noted how the issies around student loans and repayments. The University and College Union (UCU) also picked up this point but, in my opinion rightly so, asks attention to the longterm effects of the changing ITT landscape, and the hidden costs involved. They emphasize the threat to university education departments caused by reducing the direct allocation of training places to universities. A school-based teacher training provision prefers to highlight (and not suprisingly agree with) the result that a higher percentage of school-based ITT responded that the benefits of the route outweigh the costs. In a more extensive piece in Academies Week many of all these findings come together in one piece. It also mentions the ‘benefits’ of ITT routes. As this also got a mention in some tweets at the time, I’d thought I’d look into how this benefit (and costs of course) was determined in the report.

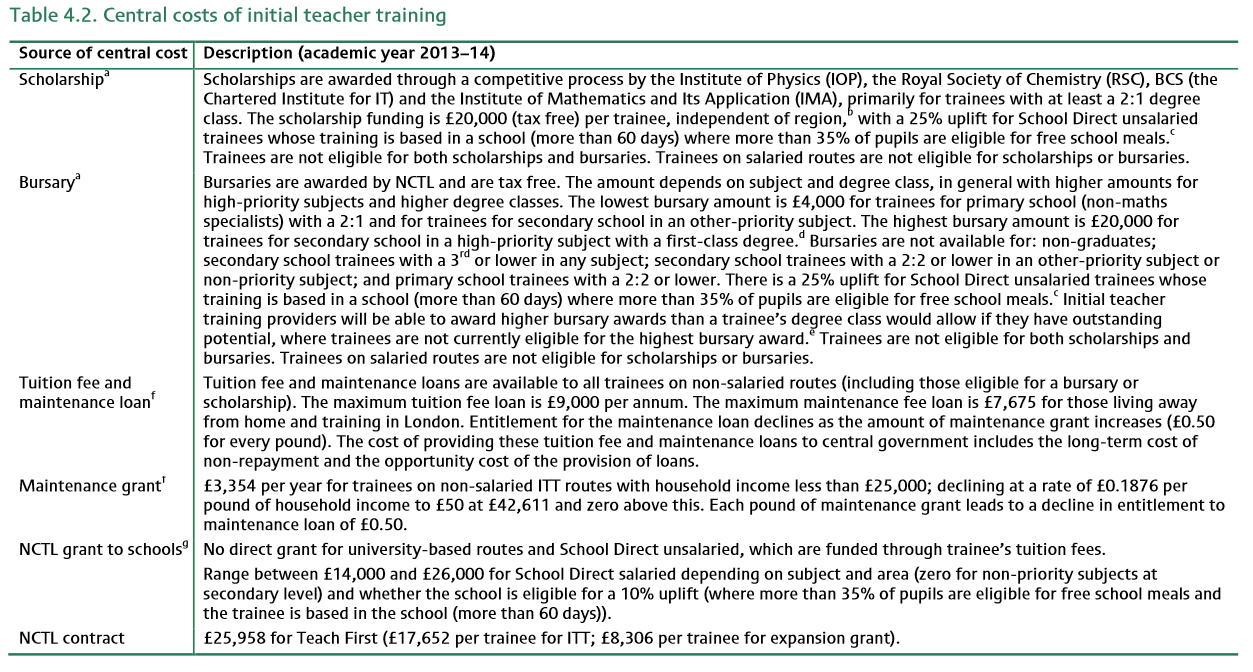
Chapter 4 of the report breaks down this topic. It first addresses the ‘central costs’ in 4.1, in which scholarships, bursaries, tuition fees and maintenance loans, maintenance grants, NCTL grants to schools, and NCTL contracts are taken into account. The key table is below. I was wondering who the recipients of these costs were throughout the report. For example, a bursary will be received by a trainee, a tuiton fee loan paid (back) by students but going to HEI’s etc. etc.

t42

After this the indirect costs for schools are caclulated in 4.2. Note that throughout the report focus is ‘Inner London’, but both primary and secondary education are looked at. This was done by, per term for primary and secondary education, looking at costs for mentoring, observations, lesson planning and other costs. This is where I feel the estimates become a bit vague. The estimates for the costs were obtained by asking respondents to report the time involved with the indirect costs associated with a specific trainee. This was combined with information on the pay category of the lead staff member involved, also representing the ‘opportunity costs of training’. The largest cost associated with ITT for primary schools is mentoring, with an average cost of around £39 per week. For secondary schools the highest was ‘observations’ and I was struck by the difference between routes: Teach First costs £29 per week, HEI-led £81 per week. I seriously wonder how this can be the case. It certainly explains the secondary schools differences in table 4.5 below.

t45
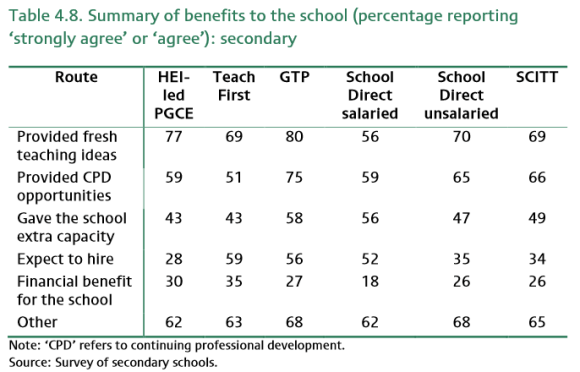
Section 4.3 then describes the benefits. I was particularly interested how the report would calculate (monetize) the benefits. Apparently it started with a simple question: respondents were asked to report the extent to which the specific trainee in their recent experience brought a number of benefits to their school/department. These benefits, and percentages ‘strongly agree’ or ‘agree’ are reported in tables 4.7 and 4.8.

t47t48
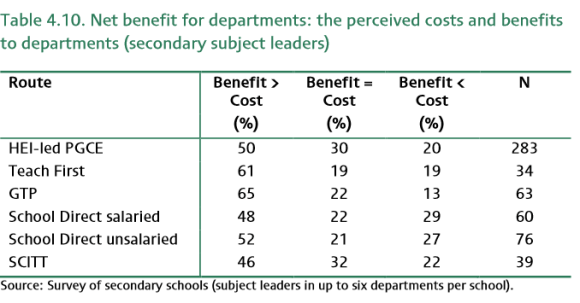
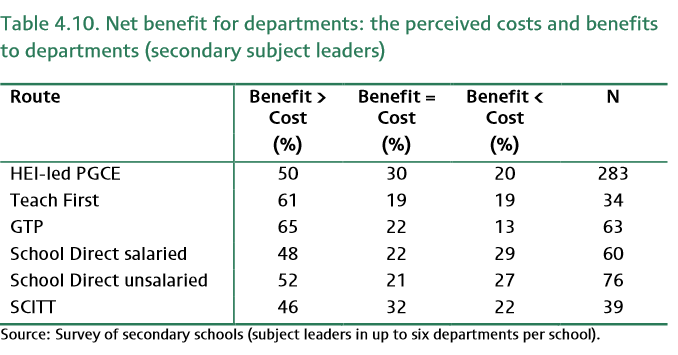
The monetary value was calculated by asking an additional question “whether the benefit for their school or department was greater than, equal to or less than the cost associated with the route, and whether this was to a ‘large’, ‘some’ or ‘small’ extent. Now, this seems somewhat subjective, maybe captured by the report’s use of the word ‘perception’.

t49

For primary, it is reported, whether it is reported that benefits outweigh the cost is related to specific benefits, especially whether the school expects to hire the trainee. This seems understandable, because you would want a large (time and money) investment not to leave the next year.

For secondary to groups of people were asked: secondary subject leaders (Departments) and secondary ITT coordinators.

t410

t411

This is all quite informative, although interpretation is difficult. It’s the subsequent monetarization that made me scratch my head. This started with assuming that net benefit was a continous variable with the answers to the question whether the benefits were less, equal or larger and the extent, as underlying property. A next assumption then is that the benefit-cost ratio has a Gamma distribution. It is argued that ‘this is reasonable’ as it is flexible and because ‘it can approximate a large range of distributions depending on the parameters.’. I find this justification unconvincing. But the assumptions continue with the assumption that respondents’ interpretation of ‘large’, ‘some’ and ‘small’ extent is similar AND that the value for each is the same above and below benefits=costs. A final assumption concerns a margin of approximation (see p.49 and appendix D of the report). Then the gamma distribution was fit to the survey results, and then draws made from the optimal gamma distribution. The draws were averaged to provide average net benefit. For the three groups, primary, seocondary subject leaders and ITT coordinators the corresponding tables are 4.16, 4.17 and 4.18:

t416

t417

These tables seem to show what these assumptions do with the results. Take Teach First, the report mentions that, for ITT coordinators, the very high average net benefit is mainly caused by higher monetary costs as reported by the ITT coordinators, but also a higher estimated benefit-cost ratio. I thought the former was very strange as table 4.6 seemed to indicate that the costs were among the lowest. I find it difficult to understand what causes the difference between these observations. This is important to understand as high costs, combined with high benefit-cost ratio, imply more benefit. The calculation of the ratio also needs to be unpicked. I somehow feel that there are far too many assumptions here for such a conclusion, especially given the nature of the original questions. One could argue that it basically is a 7-point Likert scale with benefits to large extent less than costs, to, benefits to large extent more than the costs. With assumptions that these ‘steps’ are equal, Gamma distrubution assumptions, but also that it concerns the perception of benefits-costs ratio, seems problematic to me. Appendix D further explains the procedure and it seems that the first column is the average of the calculated benefit-cost ratios (those drawn from the Gamma distribution, I presume). It makes a big difference whether values are drawn to the right of the distribution or not. Now had I taken from table 4.11, for example, that benefits>cost percentage for HEI-led ITT was comparable to, for example Teach First. I have no idea why the benefit-cost ratio is lower. Overall, given all the assumptions I think the net benefits reported in terms of ‘monetarization’ are not really sound.


Categories
Research

TALIS 2013

TALIS 2013 has been released. Another very interesting and extensive study by the OECD. I will certainly take a closer look at the dataset. Just as a quick thing I did this (nothing fancy). I downloaded the data, inserted it into SPSS, looked up


teachconstr

on p. 217 and then in the dataset

spss

And then calculated the means for every country:

spssbeliefs

Categories
Math Education Research

Longer schooldays

A recent assertion in the media (and of Gove) is that longer schooldays would lead to better performance and make life easier for working parents (see here, you can even give your opinion here). The latter is probably true but of course, in my opinion, the task for education is not to babysit children. In line with the request for evidence-based research I will present some facts and graphs. As Gove specifically refers to Asian countries I think it is relevant to use international indicators to study the hypothesis that ‘more hours lead to better performance’. Of course, it’s possible to criticize some of these indicators, but it is based on these indicators that international comparisons are made. I made use of:

– Year 8 TIMSS 2011 results for mathematics (source)
– PISA 2009 results (source)
– OECD Education at a glance data from 2012 (source)

I focused on lower secondary education as this seems best aligned with Year 8 TIMSS results.

The first scatterplots I made plotted the average number of hours per year of compulsory instruction time in the curriculum for 12-14 year olds, against the TIMSS 2011 maths result. Later, I also did this against PISA 2009.

oecdhourspisahoursinstruction

There is a very small (not significant) correlation between these variables. We can’t conclude that a larger number of hours is correlated with TIMSS and PISA performance. I then looked at teaching time:

oecdhoursteachoecdhoursteachPISA

After having seen this blogpost, confirming this, I also looked at teaching days, as a comment on the blogpost seems to suggest that there is a small positive correlation between teaching days per year and performance (note I consistently say ‘correlation’ as causal effects are very difficult to prove).

pisadaysinstructionoecddaysinstruction

Indeed, there is a small positive correlation. This, however, can be explained by hypothesizing that some countries have short days and others have long days. To explore this hypothesis I subsequently computed the ratio of the average number of hours per year of compulsory instruction time in the curriculum for 12-14 year olds, and days of instruction for lower secondary education. Plotting these:

pisa_hours_per_daytimss_hours_per_day

This suggests there is small negative correlation between the average number of hours per day against PISA and TIMSS performance. I conclude that there is no basis for the conclusion that more school time increases performance. Actually when looking at a number of OECD indicators (and also including indicators for press freedom, the GINI index for inequality, and the Human Development Index) there only seems to be one very strong correlation for both PISA snd TIMSS (which makes sense as both are strongly correlated): a higher salary per hour of net contact (teaching) time after 15 years of experience. There is a significant positive correlation between these variables.

oecdsalaryoecdsalaryPISA

Categories
ICT Research

Convenience tooling

Saw_tooth_setter_kerfIn research we often refer to ‘convenience sampling’ as sampling where subjects are selected because of their convenient accessibility and proximity to the researcher. The most obvious criticism is sample bias. In working with other researchers, reading articles and PhD students there also is a danger of something I would like to call ‘convenience tooling’: choosing the tool first tool you see, you know or has a favorable image. Now, of course there could be many good reasons why a researcher chooses to do so. Maybe it’s because he/she has worked with or developed a certain tool. Maybe the tool in question is ‘the only tool’ that has a certain features. However, to at least have some sort of reasoning behind the tool choice, in my opinion, a good researcher should give arguments why he/she chooses a certain tool. Preferably, if the need to use a tool arises because of a certain research question or framework, a researcher should write down what features for a tool are needed to answer the research question. Then it should be argued how the chosen tool provides the features that are needed. You could compare this whole process with making a requirements document. In the end, it could very well be that the choice for a tool remains the same, but at least a researcher -just as with sampling- is ‘forced’ to make some of his/her tool choices more specific.

Categories
MathEd Research

What the research says – LKL Big Data and Learning Analytics session #wtrs8

This Thursday March 21st, I attended the eighth “What The Research Says” session at the London Knowledge Lab on Big data and Learning Analytics.

The first presentation was by Jenzabar, a service provider from Boston, USA about predictive modelling of student performance. Main objectives of the project involves academic achievement and at-risk-students. The speaker talked about some developments through the years on predictive modelling, touching upon point-in-time assessments/surveys, lagging indicators and early warnings based on observations. The second presentation was about Arbor, an adaptive system. Apparently, they sport the first NoSQL database system, using tags to capture data. Other systems can connect to their API. The third presentation by Alexandra Poulovassilis was about several tracking tools, most concerned with the Migen projecmaths-whizzt. She described the evolution of teacher tools for student progress within the system. She showed an, in my opinion, very interesting visualization of student progress, essentially a logfile. I recognized a lot of the difficulties with analyzing logfiles of student progress in my PhD. Good to see they’re working on a web-based version as well. The fourth presentation showed Maths-Whizz work. I was impressed by their dashboard and visualization. Less impressed by the actual maths content I saw in the sample. For example, why do I get 0 points if my third step in the equation in the figure?

After this I attended a more detailed session by Jenzabar. Very interesting to hear more about the Learning Analytics (or is it data mining? ;-)) process. Familiar terms like logistic regression were touched upon. It resembles some of the work I’m doing now, looking at models and seeing what recall, precision etc. are. As a system, Jenzabar looks great. Visiting their website I can read Jenzabar describes themselves as “Software, strategies, and services empowering higher ed institutions to meet administrative and academic needs.”. That explains a lot; as an educator I’m more interested in what actually happens in classrooms, rather than the admin surrounding them. Algorithms behind the system range from uni-variate models to  multivariate, naive-Bayes and regression. They aim for at least 85-95% correct predictions.

I did not have much time to look at many other systems. The discussion at the end of the session primarily touched upon privacy and ethical aspects of big data. Like other topics there seems to be quite some polarization in this discussion. on the one hand you have the people (the USA seems to be pretty easy with data) who don’t seem to see anything non-ethical about collecting data from students. The other extreme is that you would have to ask permission about anything. I don’t recall that teachers who conduct pen-and-paper tests or check homework had to ask students whether they could make a judgment based on the data collected. I think the answer (again) is in the middle: we can and should use student data (I prefer the more qualitative data) but must use it sensibly. The day finished with someone suggesting we should look into ‘teaching analytics’. I agree, that’s why we’ve put this in a European bid.

Categories
Math Education MathEd Research

BSRML conference – report

I have written three posts on the BSRLM day conference on November 17th, 2012.

The three posts are:

BSRLM conference part 1
BSRLM conference part 2 Alnuset
BSRLM conference part 3

Categories
Math Education MathEd Research

BSRLM conference part 3

The fourth session by Ainley reported on the Fibonacci project, integrating inquiry in mathematics and science education. It was good to hear that the word ‘utility’ that was used, did not refer to a utilitarian view of maths, i.c. that everything should have a clear purpose. I mention this as discussions about utility often tend to end in comments like ‘what’s the point of doing algebra’? Actually, I think that does have a purpose, amongst others ‘analytical thinking’ but I prefer steering clear from these types of pointless discussions. The best slide, I though, was a slide with science, statistics and mathematics in the columns and rows with a distinction in, for example, their purpose.

It formed a coherent picture of STEM. The two examples for integrative projects were ‘building a zoo’ which I didn’t like when it concerned the context of fences that had to be built. It’s the lack of creativity that often is in textbooks as well. the second project, on gliders, was more interesting but the mathematical component seemed to belong more in statistics used. I would loved to have seen a good mathematical example.

The fifth session by Hassler and Blair was about Open Educational Resources. The project, funded by JISC, acknowledged three freedoms: legal, technical and educational. It is a project that boasted a website with educational resources, free to use, keywords and with pdf creator. Although nicely implemented, to me, it seemed to be a bit ‘yet another portal’. The individual elements weren’t that novel either, with for example a book creator also in the Activemath project. The most interesting thing was the fact that the materials were aimed at ‘interactive teaching’.

The sixth and last session was a presentation by Kislenko from Estiona. She described how in Estonia a new curriculum was implemented for educating teachers in mathematics and natural sciences. It was an interesting story, although I was wondering how ‘new’ it was, as the title had the term ‘innovative’ in it.

Together with some networking these sessions made up an interesting and useful day in Cambridge.

Categories
ICT Math Education MathEd Research Tools

BSRLM conference part 2 Alnuset

The third session I attended was more a discussion and critique session, led by Monaghan and Mason, on the topic of ‘cultural affordances’. The basis was the work of Chiappini, who -in the ReMath project- used the software program Alnuset (see here to download it) to look at (its) affordances. Monaghan described the work (a paper on the topic, there will be a publication in 2013, was available) and then asked some questions. Chiappini distinguishes three layers of affordances: perceived, ergonomic and cultural. Engestroms cycle of expansive learning is used, as I understood it, to use activities as drivers for transformation of ergonomic affordances into cultural affordances. Monaghan then asked some critical questions, under which whether the theory of Engestrom really was necessary, wouldn’t for example Radfords work on gestures be more appropriate? Another comment pondered whether the steps for expansive learning were prescriptive or descriptive. I think the former: as the author has made the software with certain design elements in mind it is pretty obvious that they have a preconceived notion of how student learning should take place.  It was pretty hard to discuss these more philosophical issues in detail. I’m not really sure if I even understand the work. Although this could be solely because I haven’t read enough about it, I also feel a bit as if ‘difficult words’ are used to state the obvious. I could only describe what I was thinking off. The article that I took home afterwards gave some more pointers. To get a grasp of this I downloaded the software, that reminded me a bit of the Freudenthal Institute’s ‘Geometrische algebra’ applets, and tried out the software. I liked the idea behind the software. In this example I’ve made three expressions, and I can manipulate x. The other two expressions change with x. Some comments:

  1. I like the way expressions are made and the look and feel, as well as the way dragging changes the expression. Also ‘dividing by zero’ causes expressions to disappear. However, why does x=0 disappear as well when I drag x to 0? (see figure)
  2. I don’t see how the drawback of every tool that allows ‘dragging’, namely just pointless dragging, in this case just to line up the different expressions, is solved. Maybe this isn’t the main goal of the software.
  3. I think that the number line should be used in conjunction with tables and graphs, thus forming a triad expression-table-graphs. The addition of things like an algebraic manipulator and a Cartesian plane seems to indicate that the authors also like more than one representation.
  4. It has far too limited scope for algebra. The 30 day trial is handy here, as in my opinion the software doesn’t do enough to warrant the price.