Categories
Education Education Research

Can research literacy help our schools?

This is the English text of a blog that appeared on a Swedish site (kind translation by Sara Hjelm).


In efforts to debunk education myths there is a real danger that research is oversimplified. This is wholly understandable from the perspective of a teacher. Finding and understanding research is a hard and difficult process. The ‘wisdom of the crowds’ might help in this, but it often remains a challenge for all involved to translate complex research findings to concrete recommendations for teachers. It is certainly not the case that teacher simply can adopt and integrate these ideas in their daily practice. Furthermore, you can shout as often as you want that ‘according to research X should work’ but if it’s not working during teaching, you will make adjustments.

Why is it such a challenge for teachers to interpret research findings? As Howard-Jones (2014) indicates, this firstly might be because of cultural conditions, for example with regard to differences in terminology in language (e.g. see Lilienfeld et al., 2015; 2017). An example of this can be seen in the use of the words ‘significance’ and ‘reliability’. Both have a typical ‘daily use’ but also a specific statistical and assessment meaning. A second reason Howard-Jones mentions, is that counter-evidence might be difficult to access. A third element might be that claims simply are untestable, for example because they assume knowledge about cognitive processes, or even the brain, that are unknown to us (yet). Finally, an important factor we can’t rule out is bias. When we evaluate and scrutinise evidence, a range of emotional, developmental and cultural biases interact with emerging myths. One particularly important bias is ‘publication bias’, which might be one of the biggest challenges for academia in generak. Publication bias is sometimes called the ‘file drawer problem’ and refers to the situation what you read in research articles often are just the positive outcomes. If a study does not yield a ‘special’ finding, then unfortunately it is less likely to be published.

Because of these challenges, navigating your way through the research landscape is very time-consuming and requires a lot of research knowledge, for example on research designs, prior literature, statistical methods, key variables used and so forth. And even with this appropriate knowledge, understanding research still will take a lot of time. For a quick scan this might be 15 minutes or so, but for the full works you would have to look in detail at the instruments, the statistical methods or you would have to follow-up other articles referenced in a paper, often amounting to hours of works. This is time that busy practitioners haven’t got. Science is incremental ie we build on an existing body of knowledge, and every new study provides a little bit more insight in the issue at hand. One study most likely is not enough to either confirm or disprove a set of existing studies. A body of knowledge can be more readily formed through triangulation and looking at the same phenomenon from different perspectives:ten experimental studies might sit next to ten qualitative studies, economic papers might sit next to classroom studies.

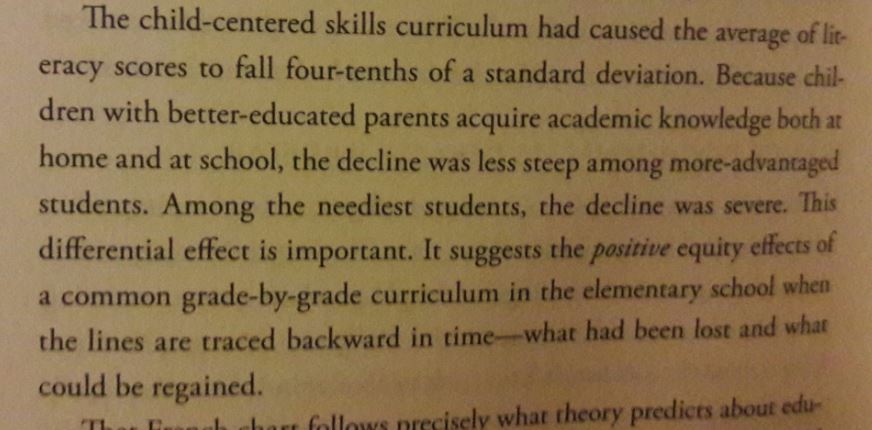
In my view, there are quite a lot of examples where there is a danger that simple conclusions might create new myths or misconceptions. Let me give two of them, which have been popular on social media. The first example is the work by E.D. Hirsch. I think his views can’t be seen separate from the US context. Hirsch is passionate about educational fairness, but the so-called GINI coefficient seems to indicate that systemic inequality is much larger in the US. Hirsch in my view also tends to disregard different types of knowledge: he is positive about ‘knowledge’ but quite negative about ‘skills’, for example. However, ‘skills’ could simply be seen as ‘practical knowledge’ (e.g. see Ohlsson, 2011), emphasising the important role of knowledge, but still acknowledging you need more than ‘declarative knowledge’ to be ‘skilled’. In his last book, Hirsch also contends that a student-centred curriculum increased educational inequality in France, while more recent data and a more comprehensive analysis, seems to indicate this is not the case (see https://bokhove.net/2017/04/26/the-case-of-france/). A second example might be the currently very popular Cognitive Load Theory by Professor John Sweller. Not everyone seems to realise that this theory does not include a view on motivation. Sweller is open about this and that’s fine of course. It does, however, not mean that it is irrelevant. Research needs to indicate what its scope is, and what it does or does not include, and subsequent conclusions need to be commensurate with the research questions and scope. This precision in wording is important, but inevitably suffers from word count restrictions, whether in articles, blogs or 280 character tweets. There is a tension between brevity, clarity and doing justice to the complex nature of the education context.

Ideally, I think, we can help each other out. We need practitioners, we need academics, we need senior leadership, we need exam boards, we need subject specialists, to all work together. We also need improved incentives to build these bridges. I am hopeful that, if we do that, we can genuinely make a positive contribution to our schools.

Dr. Christian Bokhove was a secondary maths and computer science teacher in the Netherlands from

1998 to 2012 and now is a lecturer in mathematics education at the University of Southampton. He tweets as @cbokhove and has a blog he should write more for at www.bokhove.net

References

Howard-Jones, P. (2014). Neuroscience and education: myths and messages. Nature Reviews Neuroscience, 15(12), 817-824.

Lilienfeld, S.O., Pydych, A.L., Lynn, S.J., Latzman, R.D., & Waldman, I.D. (2017). 50 Differences that make a difference: A compendium of frequently confused term pairs in psychology. Frontiers in Psychology, https://doi.org/10.3389/feduc.2017.00037

Lilienfeld, S.O., Sauvigné, K.C., Lynn, S.J., Cautin, R.L., Latzman, R.D., & Waldman, I.D. (2015). Fifty psychological and psychiatric terms to avoid: a list of inaccurate, misleading, misused, ambiguous, and logically confused words and phrases. Frontiers in Psychology, https://doi.org/10.3389/fpsyg.2015.01100

Ohlsson, S. (2011). Deep Learning: How the Mind Overrides Experience. Cambridge University Press: New York.

Categories
Education Education Research

Presentation for HoDs mathematics of Trinity group

I gave a presentation about the spatial research I did recently with 85 year 7 pupils.

Categories
Education Education Research

researchEd presentation on myths about myths

Last weekend I gave a Dutch and English version of my ‘This is the new myth’ talk. This talk did not come about in some vain attempt to take over the mythical status of some other excellent ‘mythbusters’, like Pedro De Bruyckere, Paul Kirschner and Casper Hulshof in their excellent book, but more with frustration how some facts opposed to certain myths, became simplified beyond recognition, often distorting the original message. In other words, a danger that the debunking of myths became new myths on their own. In this talk I go into how myths might come about, and give some examples, including one on iron in spinach. I then give some examples where I think facts are misrepresented on and in the (social) media. I have mainly chosen themes that are often highlighted by those who endeavour for a more evidence-informed approach to teaching, in that process purport to combat myths, but then -in my view- give an overly simplistic representation of some research findings. In the talk I cover sources that for example purportedly show ‘peer disruption costs students money’, ‘we believe research quicker if there is a brain picture’, ‘ less load is best and so there is no place for problem-based learning and inquiry in education’ and ‘student-centred policies cause inequality’. Maybe there are other robust studies that show this (although I would need to be convinced) but the sources I have observed on the web, are almost always misrepresented, in my opinion.  I realise that these descriptions *also* simplify these judgements, but the aim is not to focus on the errors per se, but that we need to be vigilant and aware of the mechanisms behind myth creation.

The slides for the talk are here:

A video of the talk is here:

I recently also saw an article (only in Dutch, I think) that nicely complements my talk and I might integrate some of the sources in a future version.

Categories
Education Research Research

Transcribing audio with less pain

forblogLike so many people I’ve never really liked transcribing audio, for example from interviews or focus groups. It is time-consuming and boring. Of course, you can outsource this but that unfortunately costs money. So I thought: “how can I do this quicker with available services.”

Last year with a colleague I wrote an article on exactly this: using the Youtube auto-captioning feature to more quickly transcribe audio. The quality of Youtube’s voice recognition has improved considerably in the last decade. The paper gives three examples, from interview audio, a classroom recording, and a Chilcott inquiry interview to show how useful this can be for transcribing audio ‘as a first transcript version’. I just posted the pre-publication.

DOWNLOAD PRE-PUBLICATIONS

To demonstrate the procedure, I applied it to my recent podcast with TES.

  1. You first need to get hold of an audio file. I assume you have it from your data collection. Sometimes you can obtain them like using apps in the browser like DownThemAll! (that one is for Firefox),
  2. Before being able to upload to Youtube, you need to make a video file out of it. For windows, I prefer Movie Maker. Unfortunately this has been discontinued, but you can still find it here. I make a video with an image and the audio as accompanying sound.
  3. Now this ‘movie’ (actually audio with one image) can be uploaded to Youtube. After a few hours Youtube should have created closed captions for the audio. Ensure that privacy settings are set correctly.
  4. The captions can be downloaded as text file via multiple tools like DIY captions or downsub. Some software is non-web-browser based, and some can also work with private settings (just as long as you are the ‘owner’ of the file, of course). The result might be a subtitle file, which could further be edited with subtitle software.
  5. You can see that this version already is pretty good. I think it captures it for around 80%. It took maybe 15 minutes of actual labour and some time for the Youtube captioning to do its work, for a 40 minute audio file.  This saves me a lot of time.
Categories
Education Education Research

Educational inequality: old paper by Hanushek

Probably one of the most influential people in OECD policy has been Hanushek. For someone from the Netherlands, the constant ‘bashing’ of selection and ‘early tracking’ has been particularly noteworthy. Mainly, because anecdotally I feel that system equality is a big factor, and also because ‘despite’ early tracking the Netherlands tends to do reasonably well in large-scale assessments (except, for some years now TIMSS year 4, which is worrying).

The most often cited paper is this paper by Hanushek and Woesmann. The important image is:

I have got some issues with the inference that ‘early tracking’ tends to increase inequality, based don this data, certainly for the Netherlands.

  1. The data is based on the dispersion of achievement (standard deviation). The Netherlands has the lowest spread in both situations, but contributes to ‘early tracking is bad’ because the SD increases. Yet it still is lowest of all included countries.
  2. PIRLS and PISA reading are two very different large-scale assessments. PIRLS is published by the IEA and their studies tend to be more curriculum focused, while PISA reading less so. I don’t think you can compare them this way.
  3. This also is hard because, as far as I know, the cross-sectional sampling is different, with one looking at classrooms (PIRLS) and the other schools (PISA). At least, that is the case now. There are several years of schooling between the two measurements, and also the samples are different.
  4. Achievement scores in large-scale assessments are typically standardised around a mean of 500, and standard deviation of 100. Standardising this again to help a comparison of two completely different tests seems rather strange. Especially if you then argue that the *slopes* denote increase or decrease of inequality.
  5. Finally, of course, causation/correlation issues.

In sum, I think it is an original study but hard to draw conclusions.


Categories
Education Education Research

researchEd national conference

On 9 September 2017 I gave a talk at the national researchEd conference in London. The presentation was about how mythbusting might lead to new myths. The presentation covered the following:

  • I started by explaining how myths might come about, by referencing some papers about neuromyths.
  • I then used the case of iron in spinach to illustrate how criticising myths can lead to new myths (paper by Rekdal).
  • I gave examples of some themes that are in danger of becoming new myths.
  • I concluded that it is important to read a lot, stay critical and observe nuance. No false dichotomies please.

I will endeavor to write this up at one point. Slides below.

Categories
Education Research Math Education Tools

Seminar at Loughborough University

Dr. Christian Bokhove recently gave an invited seminar at Loughborough University:

Using technology to support mathematics education and research

Christian received his PhD in 2011 at Utrecht University and is lecturer at the University of Southampton. In this talk Christian will present a wide spectrum of research initiatives that all involve the use of technology to support mathematics education itself and research into mathematics education. It will cover (i) design principles for algebra software, with an emphasis on automated feedback, (ii) the evolution from fragmented technology to coherent digital books, (iii) the use of technology to measure and develop Mental Rotation Skills, and (iv) the use of computer science techniques to study the development of mathematics education policy.

The talk referenced several articles Dr. Bokhove has authored over the years, for example:

  • Bokhove, C., & Drijvers, P. (2012). Effects of a digital intervention on the development of algebraic expertise. Computers & Education, 58(1), 197-208. doi:10.1016/j.compedu.2011.08.010
  • Bokhove, C., (in press). Using technology for digital maths textbooks: More than the sum of the parts. International Journal for Technology in Mathematics Education.
  • Bokhove, C., & Redhead, E. (2017). Training mental rotation skills to improve spatial ability. Online proceedings of the BSRLM, 36(3)
  • Bokhove, C. (2016). Exploring classroom interaction with dynamic social network analysis. International Journal of Research & Method in Education, doi:10.1080/1743727X.2016.1192116
  • Bokhove, C., &Drijvers, P. (2010). Digital tools for algebra education: criteria and evaluation. International Journal of Computers for Mathematical Learning, 15(1), 45-62. Online first. doi:10.1007/s10758-010-9162-x
Categories
Education Education Research

Hirsch: the case of France

(click on the image for a larger version)

I wanted to do a relatively quick post on something I have been looking at in some tweets. It is related to part of Hirsch’s book on which I had already written. I think it’s quite clear that I like Hirsch’s emphasis on the ‘low achieving’, although we probably disagree on the role ‘systemic unfairness’ plays in schooling. This post, though, wants to focus on one of the pivotal examples Hirsch presents to argue that a skills-oriented curriculum, contrary to a knowledge-based curriculum, increases unfairness: the case of France from 1987 to 2007 (Loi Jospin). I can probably write pages full on the ‘knowledge’ versus ‘skills’ (aren’t skills just practical knowledge?) but let’s just assume that these labels are wholly justified. I will also assume, but find the justification lacking, that what Hirsch says on the page regarding amount of funding, buildings etc. to *not* have had an influence on this, is true. I think it’s quite difficult to simply ascribe changes to just a change of curriculum, even though I grant him the curriculum change in France has been vast.

I tried to track down the data Hirsch used. In Appendix II Hirsch refers to documents from the DEPP. The data seems to come from a French department, and coincidentally 2015 data has recently (November 2016) been added to the database. The data is tabulated in this document on page 3. One of the headers states that ‘social inequality is still apparent but remains stable’.

The raw data indicates ‘errors’ made (the column Moyenne denotes the mean number of errors per sub-group, Ecart-type denotes standard-deviation). I did not look at the detail of the standardised tests themselves. The document mentions some limitations, for example that labels have changed a bit over time but also the massive increase in people not wanting to give there social class of the parents (PCS de la personne responsable d’eleve).

Compared with the graph in Hirsch’s book two things can be seen:

  1. There seem to be more SES (Socio-Economic Status) categories in the data than in the book. My French is a bit rusty but I think at least one large category, probably Employes, is missing. I think that is strange.
  2. The gaps between the different groups seem to have diminished between 2007 and 2015, or -looking from 1987 to 2015- there does not seem to be a SES gap increase ie no increase in unfairness.

To go a little bit further than just ‘having a look’ I then proceeded to create some graphs. I did not create Z-values and I wonder why Hirsch did, as the ‘number of errors’ in the test used is quite a standardised measure. I also tried to use the supplied ‘standard deviations’ to try and replicate the Z-values, but could not get all the numbers matched. Here is the graph Hirsch did, but now with only the errors:

1987_2007hirsch

Based on this graph (sorry, I know, labels are missing etc., and I’m embarrassed to say I used Excel) one could indeed conclude that from 1987 to 2007 gaps have increased, although the gap between ‘White collar and shopkeepers (‘Artisans, commercants’) and ‘Profession intermediaires’ has decreased. As mentioned before, maybe it’s my command of the French language that conflicts with this. I also plotted the same graph but now with all categories.

It seems as if the picture conveyed on page 145 of Hirsch’s book is far less pronounced. Of course, some of these categories are quite small, but in any case, one of the five largest groups has not been included in Hirsch’s book. I wonder what causes this discrepancy; it seems implausible that the use of Z-scores could explain that difference, but I’m open to be proven wrong.

The categories was the first element I wanted to look at, the second is the 2015 data. I plotted the new graphs with 2015 data included. I did this for both the graph with only 5 categories and all others.

It is clear that more errors are being made over the years, but the unfairness (ie increasing gaps between the different socio-economic strata) seems hard to maintain. Certainly the argument that if we ‘trace the lines backward in time in time’ would mean positive equity effects (see below) of what Hirsch calls the ‘knowledge curriculum’ seems unlikely. Like the DEPP themselves state, I think it is hard to maintain that the unfairness has increased; at least based on this French data.

Categories
Education Research

Social Network Analysis: applications for education research

Today, with Dr. Chris Downey, I gave a talk on applications of Social Network Analysis in education research. Slides below.

Categories
Education Research

Explaining a grade

I’m constantly challenging myself with regard to Comparative Judgement. In a first blog I explained why I think there might be some better reasons to use it than ‘efficient’, ‘workload’ and ‘more reliable’. I extended (and repeated) this in this book review. To me, professional development, moderation and formative feedback seem much more promising. However, I think many teachers, especially English teachers, are simply so disenamoured by KS2 English writing that they frankly see anything as improvement. They are willing to replace the current summative SATs for a different summative assessment. In the meantime I have seen several examples where I would say that teachers tried to strike a balance between both summative and formative elements. Good.

Recently, though, there is one particular aspect I have been thinking about some more, and that is the challenge of justifying a grade to one of your pupils. Is the ‘Comparative Judgement’ (CJ) process, as process that assigns grades to (subjective) work, not in danger of delegating a justification for the mark? If you are a pupil’s teacher and you give a certain mark, you know why this is the case. You go into a moderation meeting, knowing why you gave a particular mark. You might feel it is a bit subjective, and also that the criteria are ambiguous, but at least you have professional ownership of that mark. I expect that you can probably explain the mark to a reasonable degree. Even after moderation, you probably know why that particular piece scored what it scored. What about CJ? The judgement is holistic (at least in the so promoted version that saves time and so reduces workload). The grade is based on ‘the collective’ judgement of many judgers. There is no feedback as to the *why* for individual pieces of writing. So what is the justification for a particular grade? What will you tell your pupil? Maybe you feel simply referring to the collective opinion of a set of experts is enough, but surely we would want to be somewhat more precise in this?

One way to tackle this, it has been suggested, is a bank of annotated exemplars. It is not always clear whether these are meant for teachers and students or just teachers. If it’s just teachers then I guess we still have the same problem as before, in that pupils will not know about the *why* of a grade. If, however, they are used as exemplifications of when you get a higher of lower grade, I also think it’s a bit wishful thinking that pupils (but even teachers!) will simply scrutinise a pack of annotated examples, and then will extract where they can improve. It is ironic that this seems to incorporate a form of ‘discovery’: “discover the criteria we holistically and collectively used, and therefore don’t know ourselves but hey we are experts, to judge yourself what is important”. I predict that very swiftly, teachers will be formulating criteria again: ‘this exemplar had only few Spag errors, was well structured but not very original, and therefore scored higher than this other one that had a similar amount of Spag errors and structure but was highly original’. Always in comparative perspective, of course, an absolute mark -although assigned in a summative assessment- could only be justified in a relative notion. I continue to think that many of the challenges correctly diagnosed with descriptors and criterion-based assessments will continue to exist, but now with a myth that assessment is very easy: you just compare with others and holistically judge them. Rather than think this, I think it is better to appreciate assessment is hard and take in more general conceptions of what constitutes reliability and validity.