Categories
Education Math Education MathEd Tools

Marbleslides

As some may know I’ve had an interest in technology for maths for quite some time now. Because of this I am very aware of what the developments are. One of the latest offering from the wonderful online graphing calculator from Desmos, consists of their ‘activities’. Although every maths teacher should stay critical with regard to integrating ‘as is’ activities in their classrooms, I also think they should be aware of this fairly new feature. That is the reason I flagged it up during some ‘maths and technology’ sessions I ran for the maths PGCE. But always as critical consumers.

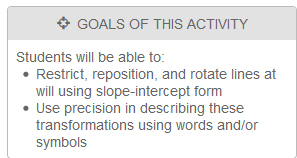
One of the latest offerings is the Marbleslides activities. I first read about it on Dan Meyer’s blog. There are several version of it, with linear functions, parabolas and more. As always the software is slick and there is no doubt the ‘marble effect’ is pretty neat. It reminds me of a combination of ‘Shooting balls‘ (linear functions, Freudenthal Institute, progressive tasks), ‘ Green globs‘ (functions through the globs) and also the gravity aspects of Cinderella. It has already been possible to author series of tasks with the latter widget. I first tried the ‘marbleslide-lines‘. The goals of the activity are:
desmos1
The activity starts off with some instruction on the use of it. Many questions arise:

  1. Why do the marbles start at (0,7) ?
  2. Are the centers of the starts ‘points’? (this becomes important later on)
  3. Why several marbles? Why not one?
  4. Why do the marbles have gravity?
  5. How much gravity is it? 9.8 m/s^2?

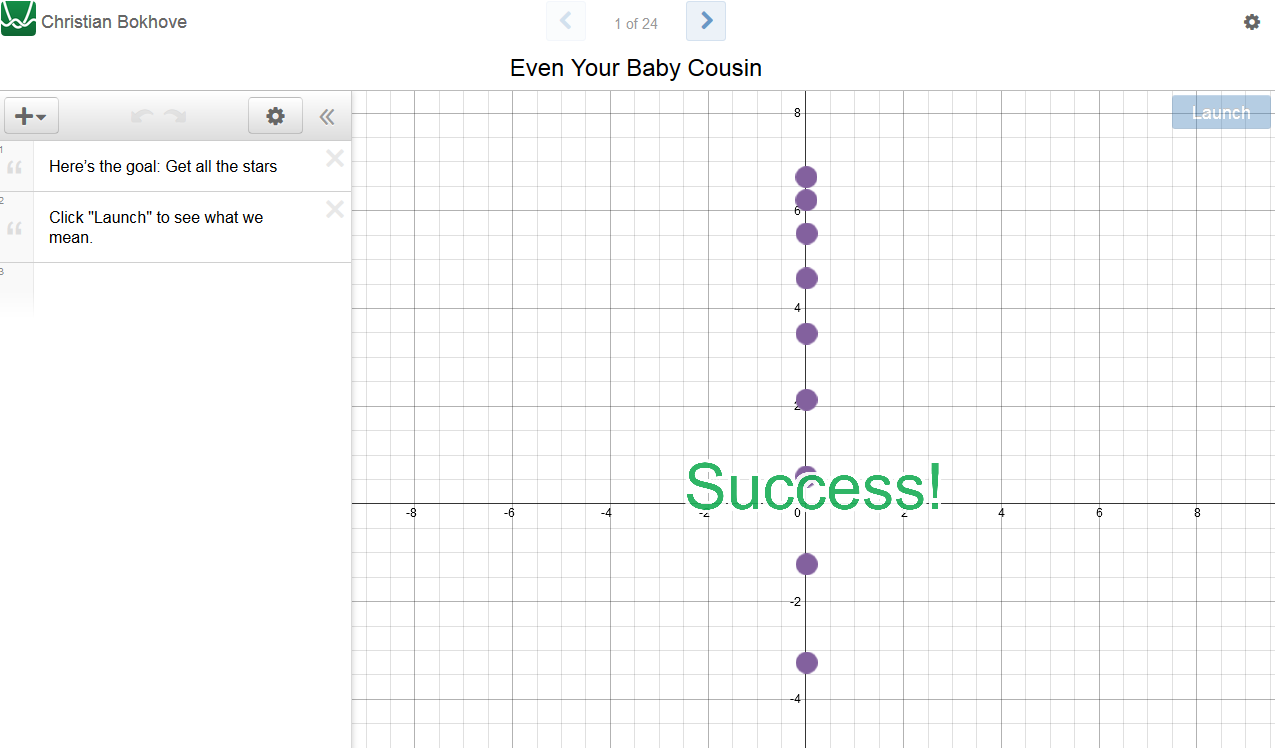
Clicking launch will make the marbles fall and because they fall through the stars ‘success’ is indicated.

desmos_p1

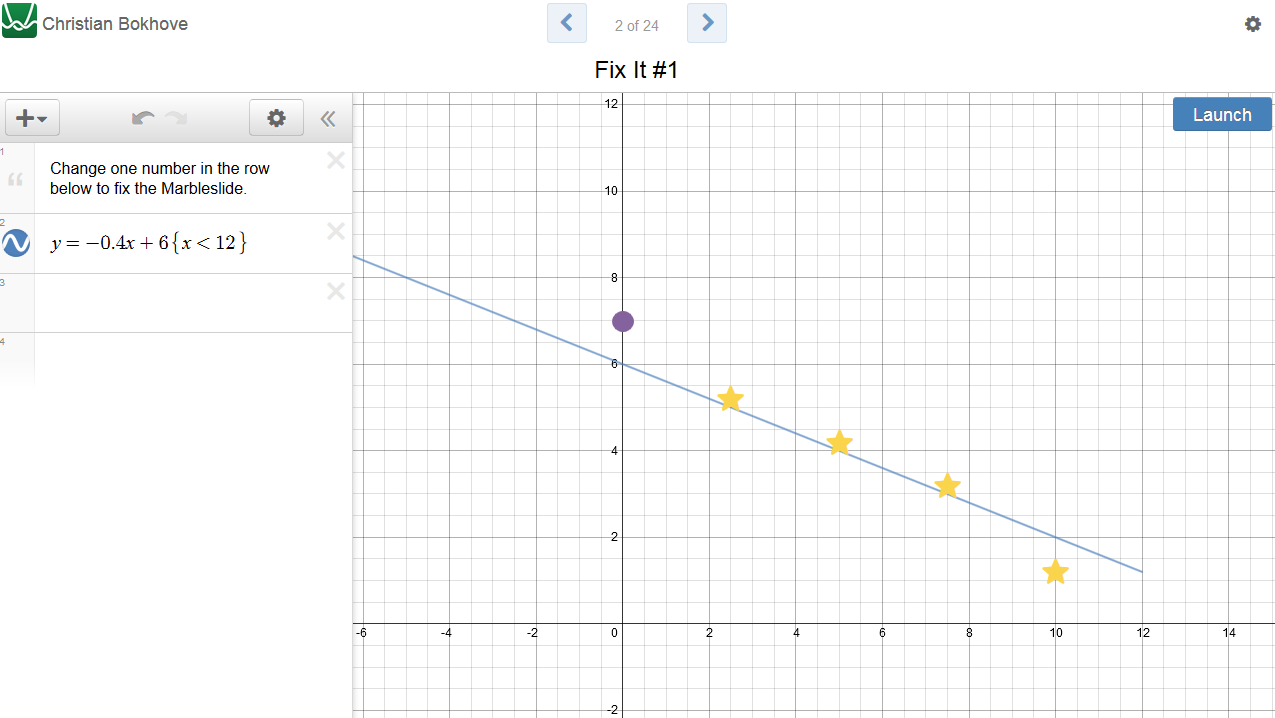
I am already thinking: so is the point to get through the points or the stars? And if gravity is at play, does that mean lines do not extend upwards? Any way, I continue to the second page, where I need to fix something. What is noticeable is 1. yes, the marbles again are at (0,7), 2. the line has a restricted domain, 3. the star to the right is ‘off line’. I’m not much more informed about the coordinates of the star, which leads me to assume they don’t really matter: it must be about collecting them. ‘Launching’ shows the marbles only picking up only two of the stars (for movie, see here).

desmos_p2The line has to be extended. The instruction is “change one number in the row below to fix the marble slide”. A couple of things here: what is there to fix? Is something really broken? The formula has a domain restriction. Do we really want to use the terminology of this domain being broken? I removed the domain restriction. This is ‘just’ a normal line. But it doesn’t give all the stars so ‘no success’. Restricted to x<12 no. For x<9 marbles shoot over. x<7 and there is success.
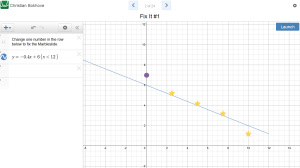
desmos_p2_2This is very much trial and error, partly caused by the gravity aspect.

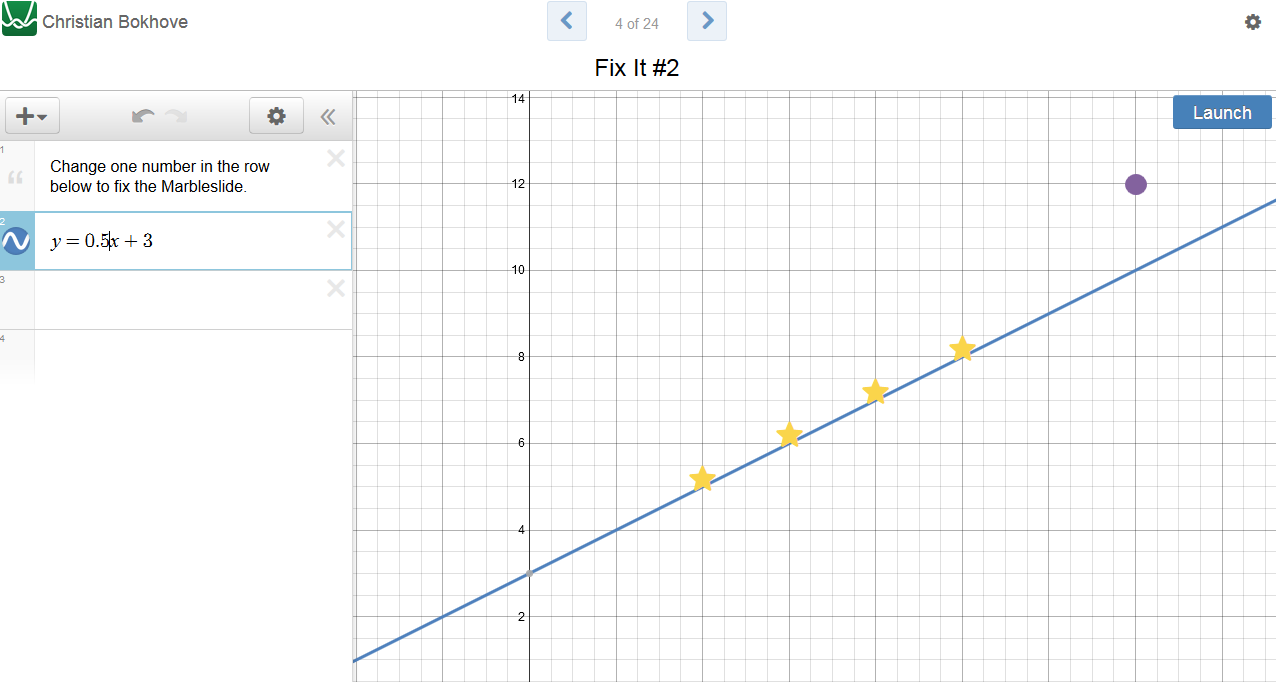
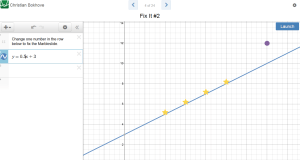
On page 4 there is a more conventional approach: there is a line with a slope. The prior knowledge indicated in the notes mentions y=mx+b should be known: “Students who know a little something about domain, range, and slope-intercept form for lines (y=mx+b)”. I wonder why this terminology is not used then. Again the formulation of the task is “change one number in the row below to fix the marble slide”.

desmos_p3Because it’s relatively conventional I guess the slope is meant. But am I meant to guesstimate? Or use the coordinates? Does it matter? I first tried 1 (yes, I know that’s incorrect) and I just keep on adjusting.
desmos_p3_2

0.5 seems ok, but 0.45 is ok as well, even 0.43. 0.56 does as well, but 0.57 misses a star because the line runs above it. May I adjust the intercept? I can, so this again promotes trial and error over thinking beforehand, in my opinion. In addition, it does not instill precision.

On page 5 the same thing but now for the intercept.
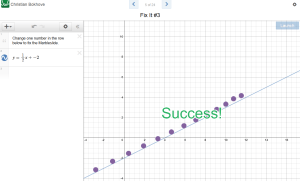
desmos_p5I’m still curious why the terminology of y=mx+b isn’t used. I guess -2 is expected as nicest fit but I can go as far as -2.7 to get ‘success’, yet -1.4 is ‘no success’. This could be seen by the teacher, of course (well, we can make any confusion into an interesting discussion, of course). It is interesting to see the marbles now start from higher up, by the way. The gravity question becomes more pertinent. How much gravity? And there is a bounce, surely the bounce is more if the gravity or hight is greater? Or not? Apart from the neat animation, what does it add?

Then on page 6 we go to stars that are not on one line (surely too quick?). There again are several answers, which in my opinion keeps on feeding the idea that points (but sure, they are stars) do not uniquely define a line.

desmos_p6From page 7 predictions are asked when numbers are changed. There still is no sign of terminology. It is a nice feature that the complete Desmos tool can then be used to check the answers. This is about functions, unlike the marbles section. Why is the domain still restricted, though? Throughout the tasks it seems as if domain and range are modified to suit the task, rather than a property of functions. Granted, a small attempt to address it is in page 11.

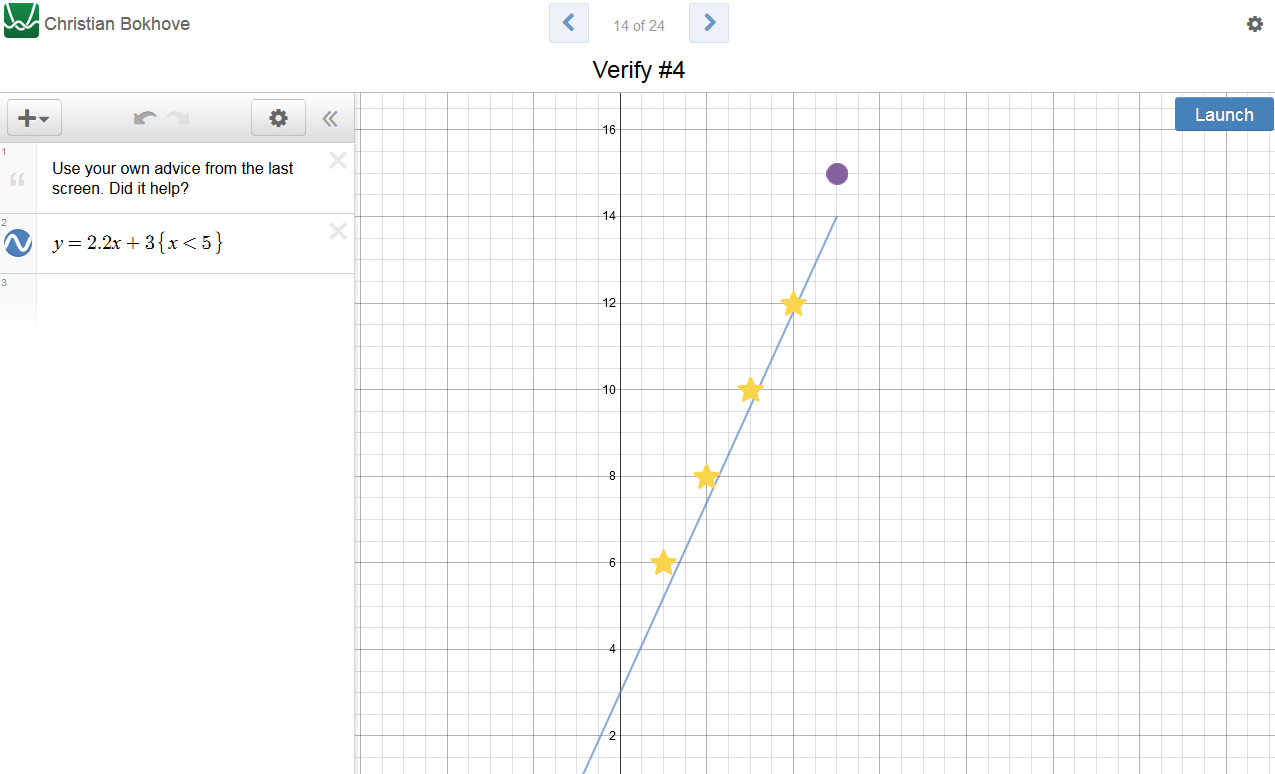
On page 13 the stars are back again. The first attempt with whole numbers is exactly right y=2x+4{x<5}. Some marbles fell to the right of the line though. Nevertheless, there was ‘success’. But there also was success on page 14 like this:

desmos_p14_2From page 15 there are challenges. The instruction says to “Try to complete them with ONLY linear equations and as FEW linear equations as possible.” These are a lot of fun, but I struggle to see the link to slope-intercept form y=mx+b. It is not mentioned explicitly. There is no real attempt to link to the terminology. I fear it will remain a fun activity with a lot of creative trial and error.

desmos_p17I’ve also looked at the parabolas activity. The same features are apparent here: functions are collections of points (rather: stars) and functions have to be found that go through them. The assertion is that transformations of graphs are somewhat addressed concurrently, but the trial and error aspect makes me doubt this. It also deters from general properties of graphs like roots, symmetry, minimums, maximums. I can see a role for playful estimates but in my opinion they must be anchored in proper terminology, precision and properties of graphs. Furthermore, I was inclined to sometimes just use lines. There was no feedback as how this was not permitted. One could even say a line also is polynomial, so why wouldn’t I. The trial-and-error nature might further incentivise these creative solutions. Great, of course, if you know transformations already but not if the activities are meant to strengthen skills and understanding (did I ever say they go hand in hand? 🙂

Some of these aspects might be mitigated by the editing feature that will be released soon, but surely not all answers to fundamental but friendly critique will be “do it yourself”? Another nice feature of course, also in other software, is that you can see student work. Yet I feel with some of these fundamental issues not properly addressed, misconceptions might arise. I think that the marble animation is at risk of obfuscating what the tasks should be about. It might lead to more engagement (fun!) but if it does not lead to learning or even might lead to misconceptions, is that helpful? Firstly, I think the scaffolding of tasks should be more extensive with a clear link to maths content. Secondly, I would reconsider the confusion between ‘points on a line’ and ‘stars to collect’. I hope Desmos can iron out some of these issues, because one thing is sure: the falling marble effect remains a joy to behold. However, pedagogically, I think as it stands it needs to be developed further.
Categories
Education Research

Research on teaching in Higher Education

I recently have been doing a lot of thinking on the Teaching Excellence Framework. For this reason any blog article that talks about quality of teaching in HE is interesting to me. For example the Times Higher Education article on a study which suggests that “students taught by academics with teaching qualifications are more likely to pass, but less likely to get first-class scores.” The underlying study is this one. I was very surprised to read this article. The article compares teachers with only a PhD and teachers with a PhD AND a teaching certificate (all other types were disregarded).  In my opinion there are several big problems with the study, some demonstrated by one of the central table:

diff

What immediately is apparent:

  • There are no significant differences between PhD and PhD-TeacherCert, as the last column demonstrates (yes I know the limitations of p-values, but the article actually refers to them).
  • Look at the numbers: with such low numbers you can really not make the inferences any way.
  • There is a particularly hard to understand paragraph to argue that we can’t just say that ‘2% versus 5% non-pass might not seem much’ (top line). Well, it isn’t much, so I can’t see how one can argue the opposite.
  • I like it even less that then these highly contentious results are used to suggest two types of teachers, not unlike how glossy magazines do, ‘damage controllers’ and ‘perfection seekers’.
  • The study calculates a ‘group GPA’ for every module which is seen “metric to evaluate the quality of learning from Units”. What? Grades as a metric for quality without regarding other elements like assessments?
  • The group GPA was calculated by converting scores to a Likert scale, in what to me seems a rather arbitrary manner. Luckily this was deemed a little bit ‘contentious’ by the authors.

But there is more:

  • There is almost no development of a framework. After half a page of abstract, there is half a page of introduction and then it’s straight on into the research question and methodology.
  • The limitations section was 2 (two!) lines long, only reporting on how qualitative data was not collected.
  • As a consequence the article is a mere 7 pages. I love concise articles but this is a bit too extreme. On the upside, I assume this journal likes such short articles.
Categories
Education Politics

Thoughts on the HE green paper

I was asked to give my thoughts on the HE green paper. Here are some thoughts.

  • I agree with a strong emphasis on teaching.
  • This can be improved considerably but it is a caricature to suggest that teaching is not valued.
  • A stronger emphasis on teacher should not mean that it’s just another extra obligation. It must be understood that if we want more emphasis on teaching, perhaps there must be less emphasis on research. A nightmare scenario would be that the TEF adds to the bureaucracy of HEIs
  • In other words, it should not be another REF, but then just for teaching. Certainly if we want a cross-over between research and teaching (p. 20), especially important perhaps for an Education School, then this also means appreciating what can’t be done.
  • Measuring ‘teaching quality’ is difficult. Using multi-modal approaches is better than simple metrics. I think chapter 3 on the TEF addresses this quite reasonably.
  • Teaching is a collaborative affair where teachers (staff) are experts who ‘teach’ students. Teachers together with students. A too student-centered approach (aimed at what the students want) is not desirable. Students do not always know best. Metrics like the NSS are very arbitrary and do not correlate strongly with teaching quality. Research shows that variance of surveys like these lies more at the student level and not institutional level, in other words differences within HEI are much larger than between HEI. This means that comments like on p.19 (point 7.) are unwarranted, as hardly any variance on student experience and engagement can be explained at the HEI level. I appreciate that this can be mitigated by using multiple sources for determining ‘teaching quality’ but this must really be key. In addition, good teachers already listen to students.
  • The link between ‘teaching quality’ and raising fees is undesirable. The comment on p. 19 on ‘value for money’ is subjective as ‘value for money’ can also mean that the fees should be lowered (this would be a good idea), thus increasing the ‘value for money’. Yet, in this context it is used to argue the value should be increased. Given the high scores for the NSS, this seems strange. Further, the HEPI-HEA research also says (p. 9): “Unsurprisingly, when asked about their top three priorities for institutional expenditure, 48% of students chose ‘reducing fee levels’. However, four further clear priorities emerge, each chosen by over one-third of students:  increasing teaching hours, decreasing class sizes, better training for lecturers  and better learning facilities.”. The current report seems to what one-sidedly have chosen only a few of these items.
  • There is another inconsistency in all of this: if teaching quality for students is improved, partly based on student judgements, I presume, students are ‘rewarded’ with higher fees. This seems very paradoxical, very ‘anti market’, and could also set teachers against students.
  • GPA seems more appropriate than the current ‘banding’ but the problem is more that student achievement is conflated with ‘teaching quality’. Certainly with a strong contribution of student evaluations I doubt a new system will do away with a tendency to have higher grades. The new system even seems to incentivize this. I would prefer actions that really do something about root causes. Luckily the limitations are acknowledged on p.26 (point #41).
  • On participation the document does not convey any sense of wider, systemic reasons for a lack of participation, for example Socio-economic inequalities. Of course this document is about HE but like many foci, some acknowledgement of this would have been good.
  • The changes in the market do not acknowledge that there is no real market. Like many semi-public examples this will combine the worst of both worlds.
  • On the education structure: students should not be at the center: students AND teachers should be at the center. In point 4 staff is sorely missed. In addition, ‘market principles’ are very central. It also says ‘affordable’ which seems counter to the fee developments in the last decade. A name ‘Office for Students’ fails to acknowledge HE is a joint affair.
  • The changes in the architecture seem very reasonable but the question needs to be asked “what does this restructuring really solve?”. It sounds like rebranding exercises the private sector often does: old wine in new wineskins. The costs of these reforms are often underestimated (e.g. IT costs).
Categories
Education Research

Presentation at BSRLM day conference

These are the slides of the presentation “Opportunity to learn secondary maths: A curriculum approach with TIMSS 2011 data” I gave at the BSRLM day conference on 7 November 2015 at the University of Reading.

Categories
Education

[Dutch post] Maatwerk: de verengelsing van het onderwijs

Afgelopen Juni stuurde ik onderstaande reactie naar iemand van de VO-raad. Het vat goed samen hoe ik over de huidige ontwikkelingen naar een zogenaamd maatwerkdiploma denk: “Mijn betoog is echter dat er een levensgroot gevaar is dat de wens om maatwerk te leveren, naar mijn mening ingegeven door een relatief kleine groep anekdotische dramaverhalen, gaat leiden tot ‘Engelse toestanden’. Dus dat we een groot pluspunt van het Nederlandse systeem op losse schroeven zetten voor een ideaal dat nooit bereikt gaat worden.”

Ik probeer wat zaken te formuleren die mij te binnen schoten in alle discussies op twitter. Ik heb niet te veel op die precieze bewoording gelet en ben gewoon gaan schrijven; het kan op punten onsamenhangend zijn. Grosso modo komt het er op neer dat ik bang ben dat het Nederlandse systeem te veel ‘Angelsaksisch’ gaat worden: meer selectie en meritocratie. Ik denk dat het moeilijk valt te ontkennen dat economisch gezien de UK en VS ongelijker zijn. Dit geldt ook voor onderwijs. Met alle voorbehouden van dien (met name met betrekking tot validiteit PISA’s, PIAAC’s, TIMSS van de wereld) is 1 aspect in Nederland dat de spreiding van scores kleiner is, met andere woorden de slechtere leerlingen doen het nog steeds vrij goed in Nederland. In de UK is dit niet het geval, Dit terwijl ze ‘op papier’ veel van de voordelen zouden moeten hebben waar nu hoog over wordt opgegeven. Laat ik eens enkele zaken opsommen:

  1. De gedachte dat in Engeland (ik zeg UK maar Schotland is behoorlijk anders) meer maatwerk zou zijn stamt denk ik van de gedachte van het ‘oude systeem’ met O en A levels. Het romantische beeld van de 10-jarige wiskundegenie die al naar de universiteit kan gaan. Los van diverse andere uitdagingen die dit met zich meebrengt is het in de praktijk niet zo romantisch. Op paper zijn er ‘allerlei kansen’ om naar hogere niveaus te gaan, in de praktijk wordt dit gegeven gebruikt om eigenlijk -als het niet lukt- de verantwoordelijkheid op kinderen af te schuiven. Immers, je *kunt* naar een hoger plan maar je haalt het niet. Dus in mijn ogen zorgt dit er juist voor dat er meer ongelijkheid komt (zie ook de volgende punten).
  2. Het toetsen in de UK wordt op papier veel langer uitgesteld. Einde basisonderwijs zijn er de SATs maar die dienen niet voor plaatsing VO. Ze zijn er alleen om basisscholen op ‘af te rekenen’. VO plaatsen worden vergeven op basis van ‘catchment’, kortom waar je woont. Dit is natuurlijk al sterk verbonden met Socio-Economische Status, beter bedeelden wonen in gebieden met doorgaans betere scholen, mede omdat catchment ook huurprijzen en huizenprijzen (indirect) bepalen. Dit leidt tot straten waar ene kant straat met zelfde huizen andere kant 200 pond per maand duurder. Maar het is nog gekker, op papier begint iedereen ‘gelijk’ aan de VO maar om ‘maatwerk’ te leveren voor ‘de betere leerling’ kun je sommige vakken op een ‘hoger niveau’ doen. Hierbij krijg je meer leerstof aangeboden. Dit werkt dan weer door in het VO alwaar alweer op paper ‘iedereen gelijk is’ maar kinderen na een paar maanden in zg. ‘sets’ worden ingedeeld. Eigenlijk is dat gewoon ‘ability grouping’ waarbij het idee dan is dat je kunt ‘opstromen’ per vak als je daar talent voor hebt. Op papier dus weer ‘maatwerk’. Maar ook dat werkt in de praktijk niet: lagere sets kom je bijna niet uit, omdat het sociaal-pedagogische klimaat niet optimaal is (zeg maar, er wordt niet opgelet, want iedereen straalt uit ‘we zitten inde laagste set. Daarnaast wordt niet alle stof onderwezen (Opportunity to Learn). Dus heb je een achterstand, demotivatie, de lagere sets blijven veroordeeld tot lager, hogere worden hoger. Ogenschijnlijk maatwerk leidt tot ongelijkheid.
  3. Het is al vaker geopperd op twitter en vervolgens wordt er gezegd ‘maar we willen niet dat het lagere geaccepteerd wordt maar dat als iemand wat meer kan (ik moet denken aan Rosenmullers wiskunde op VWO voorbeeld) dit ook kan. Ik denk dat dit veel minder vaak gaat voorkomen dan wat naar mijn mening veel meer de trend is: de voorbeelden van de VWO leerling die niet goed in talen is en dreigt niet te slagen, die talen op een lager niveau gaat doen. Het meest heldere systeem blijft voor mij een uniform diploma. Waarbij aangetekend dat het allang niet uniform meer is met profielen, keuzevakken en zelfs al maatwerkregelingen. Dat is al genoeg maatwerk en ik denk dat het overgote deel van de leerlingen daar prima mee kan opschieten. ik heb daarom ook al eens geopperd dat de omvang van ‘het probleem’ maar eens helde rgemaakt moet worden. Dat is niet wat anekdotes hier en daar. Het vereist ook dat duidelijk wordt gemaakt dat het hudiige systeem fnuikend is. Dat betekent niet hier en daar een anekdote dat iemand niet heeft kunnen doen wat hij/zij wil (en bovendien zal hier de neiging zijn om ‘het systeem’ de schuld te geven). Ik denk dat het ‘probleem’ wel meevalt.
  4. Ranglijsten en rankings. We werken naar een systeem met ongelijke diploma’s (want maatwerk). Dit systeem zal leiden tot veel verschillen aan het einde van het VO, zoals nu in Engeland met GCSEs. In Engeland zijn er dan nog meer verschillen aan het einde van A-levels en vervolgens is er het Hoger Onderwijs waarbij de A-level cijfers de doorslag geven. In het voorjaar schrijven toekomstige studenten zich in en krijgen ze zogenaamde ‘offers’, bijvoorbeeld ‘als je drie A*’s haalt (A*A*A*) dan willen we je graag naar Oxford. Soms zijn die zelfs ‘unconditional’. Ook moet je soms nog een aanvullende toets doen of een intake gesprek (meestal de betere universiteiten, bij ons is dat bijvoorbeeld al zo voor de lerarenopleiding). De prestigieuze, hoger op ranking staande universiteiten en opleidingen kunnen hogere eisen stellen. Neem mijn uni (zg. Russel Group, zeg maar sub-top, top 20), engineering AAA, de meeste opleidingen AAB, wat minder populaire ABB, maar niet lager. Vervolgens doe je A-level examens. Haal je het dan kun je je ‘offer’ opnemen en naar de uni in kwestie. haal je het niet, dan moet je alsnog een plek zoeken in September (dit heet ‘clearing’). Opleidingen proberen daar hun overgebleven plaatsen te vullen. 1 Oktober begint het Academische jaar, mede ook om die reden. Ik zie het als volgt: doordat er zo veel verschillen zijn in de ‘pakketten’ voor A-levels, iedereen kan een ander pakket, is er maatwerk. Maar hierdoor is er geen uniforme toelatingseis te stellen. Universiteiten zullen selecteren. Maatwerk leidt tot selectie. Selectie leidt tot competitie. Het voorland van Nederland als er ‘maatwerk’ komt. Dat is geen goede zaak.

Nou snap ik dat ik in dit hele relaas al meerdere keren heb gezegd dat het ‘in de praktijk’ niet werkt. De gedachte kan daarom zijn ‘maar het is wel een mooi idee dus wij doen het gewoon anders en beter, en dan gaat het goedkomen’. Mijn betoog is echter dat er een levensgroot gevaar is dat de wens om maatwerk te leveren, naar mijn mening ingegeven door een relatief kleine groep anekdotische dramaverhalen, gaat leiden tot ‘Engelse toestanden’. Dus dat we een groot pluspunt van het Nederlandse systeem op losse schroeven zetten voor een ideaal dat nooit bereikt gaat worden.

Dit alles laat niet onverlet dat (i) de betere leerling beter bediend kan worden, (ii) maatwerk soms heel handig kan zijn. Over (i): persoonlijk denk ik dat dit meer een mentaliteitskwestie is. Ik heb nooit goed begrepen hoe we personen anders dan ‘de betere leerling’ in het VO verantwoordelijk kunnen houden of ‘het er echt uit komt’. Als een puber, en dat valt best te begrijpen, zichzelf niet tot daden kan aanzetten dan moet deze daar aan werken. Al dan niet gesteund door ouders, schools enz. Maar hij/zij moet het wel doen en de actoren om hem/haar heen moeten niet. Dat is geen ontkenning van de rol van het onderwijs; die moet ‘slechts’ (blijven) doen waar ze goed in zou moeten zijn: onderwijzen. Over (ii): hier kan de wet misschien wat vrijer gemaakt worden. Maar dat is geen systeemwijziging. Het opstromen en stapelen weer makkelijker maken, iets wat ook de inspectie constateeert (maar dan gek genoeg in plaats van te zeggen ‘dat is slecht’ ook op de maatwerk-toer gaat), is een veel snellere en minder risicovoller manier om de toegankelijkheid goed te houden maar toch meer maatwerk te leveren. Het legt ook de verantwoordelijkheid bij de leerling, niet het onderwijssysteem.

Categories
Games

Avid gamer

As some might know I’m quite an avid gamer (but lately have less time, still have to finish Witcher 3). I wrote about my best 2014 games before and also about games in maths education. This is an invited lecture I gave at Winchester School of Arts about narratives in games.

Categories
Education Education Research Games ICT Math Education MathEd Tools

Games in maths education

This is a translation of a review that appeared a while back in Dutch in the journal of the Mathematical Society (KWG) in the Netherlands. I wasn’t able to always check the original English wording in the book.

Computer games for Maths

Christian Bokhove, University of Southampton, United Kingdom

51iyzu1DTlL._SX326_BO1,204,203,200_Recently, Keith Devlin (Stanford University), known of his newsletter Devlin’s Angle and popularisation of maths, released a computer game (app for the iPad) with his company Innertubegames called Wuzzit Trouble (http://innertubegames.net/). The game purports to, without actually calling them that, address linear Diophantine equations and build on principles from Devlin’s book on computer games and mathematics (Devlin, 2011) in which Devlin explains why computer games are an ‘ideal’ medium for teaching maths in secondary education. In twelve chapters the book discusses topics like street maths in Brasil, mathematical thinking, computer games, how these could contribute to the learning of maths, and concludes with some recommendations for successful educational computer games. The book has two aims: 1. To start a discussion in the world of maths education about the potential for games in education. 2. To convince the reader that well designed games will play an important role in our future maths education, especially in secondary education. In my opinion, Devlin succeeds in the first aim simply by writing a book about the topic. The second aim is less successful.

Firstly, Devlin uses a somewhat unclear definition of ‘mathematical thinking’.: at first it’s ‘simplifying’, then ‘what a mathematician does’, and then something else yet again. Devlin remains quite tentative in his claims and undermines some of his initial statements later on in the book. Although this is appropriate it doesweaken some of the arguments. The book subsequently feels like a set of disjointed claims that mainly serve to support the main claim of the book: computer games matter. A second point I noted is that the book seems very much aimed the US. The book describes many challenges in US education that, in my view, might be less relevant for Europe. The US emphasis also might explain the extensive use of superlatives like an ‘ideal medium’. With these one would expect a good support of claims with evidence. This is not always the case, for example when Devlin claims that “to young players who have grown up in era of multimedia multitasking, this is no problem at all” (p. 141) or  “In fact, technology has now rendered obsolete much of what teachers used to do” (p. 181). Devlin’s experiences with World of Warcraft are interesting but anecdotical and one-sided, as there are many more types of games. It also shows that the world of games changes quickly, a disadvantage of a paper book from 2011.

Devlin has written an original, but not very evidenced, book on a topic that will become more and more relevant over time. As avid gamer myself I can see how computer games have conquered the world. It would be great if mathematics could tap into a fraction of the motivation, resources and concentration it might offer. It’s clear to me this can only happen with careful and rigorous research.

Devlin, Keith. (2011). Mathematics Education for a New Era: Video Games as a Medium for Learning.

Categories
Education Research

ResearchED 2015

Today I want to researchED at South Hampstead High School in London. It was a very fruitful day. Can’t say I heard a lot of new things, I knew most things, either because of my ‘job’ or because I had already read and heard of it via the blogosphere. But it was also very important: speaking from my background as a former secondary maths and computer science teacher and now lecturer/researcher (with some involvement in teacher training as well) I thresearchED-logoink it’s vital that practitioners (practice) and researchers work together in partnership. There are many obstacles for this to happen – I imagine I might know about the obstacles from both sides, practitioners and researchers, because I have experienced and am experiencing both. These are two distinct cultures that need to ‘bridge’ the gap. For this, government needs to ‘invest’ and not think -like with the maths hubs- volunteering can cover this. But ok, enough about that. A kaleidoscope of sessions I visited (although I did tweet about some ‘abstracts’ I read but couldn’t visit).

I started off with Lucy Crehan who reported on international comparisons and her experiences with visiting six countries to discover their education system. I liked this session a lot because I work quite a lot with international comparative but also with more qualitative data from, for example, the TIMSS video study. I try to combine both in the international network project ‘enGasia‘ in which England, Hong Kong and Japan collaborate to (i) compare geometry education in those countries, (ii) design some digital maths books for geometry, and (iii) test them both qualitatively through Lesson Study and more quantitatively through a quasi-experiment. Some of the work from John Jerrim was mentioned.

Then I finally got to see Pedro De Bruykere (slides here), whom I already knew to be a very engaging and funny speaker. He went through many of the myths in the book he wrote with Casper Hulshof and Paul Kirschner: Learning Styles, Learning pyramids, some TED talks (Sugata Mitra who featured in previous blogposts here and here, and Ken Robinson). I can recommend the book as a quick way to get up to speed to myths (and almost-myths). I liked how Pedro described how the section on ‘grade retention’ became more nuanced between the Dutch and English editions of the book because of the results of a new study.

Then back to international comparisons with Tom Oates. I already knew his report on textbooks and I agree that textbooks have to offer us a lot. But then again, I would think that: in the Netherlands maths (my subject) textbooks are used a lot and edited the proceedings of the International Conference on Mathematics Textbook Research and Development 2014. Tim’s talk covered quotes on international comparisons and unpicked the problems (fallacies, faulty arguments) with them. He had a measured conclusion:

After lunch I went to the #journalclub with Beth Greville-Giddings for some cookies. I had prepared by reading the article and making these annotations. The session explained the process of starting a journal club first and then we discussed the paper. One interesting moment was when people discussed the statistics in the paper. I agreed with comments that because we were dealing with a reputable journal the statistics probably were correct. But in my view there is another problem: statistical literacy. In this paper two things stood out for me (statistically, there were more like the definition of engagement): the term ‘significant’ and ‘variance explained’. With largescale data the sample size often is quite high, causing significance more quickly. Because of this reason ‘effect size’ is probably more appropriate. Secondly the statistics seemed to show that not much more extra variance is explained by adding engagement predictors. Any way, journal clubs to me seem like a worthwhile venture; might be good to forge partnerships with HE as well.

Crispin Weston then gave a lecture on how technology might revolutionise research. He framed this by first describing 7 problems and then showing how technology might ‘improve’ or ‘address’ them. It was an interesting approach which resulted in a matrix with ‘solved’ problems. Learning Analytics and standards (see my response to W3C priorities) had a prominent place. I’m a bit skeptical of it all will work. In the MC squared project we are implementing some Learning Analytics, including for creativity, and it’s bloody difficult.

Sri Pavar then talked about Cognitive Science. I think it’s good to summarise these principles. Principles like a memory model and relevant books (although some books referenced were not really about Cognitive Science) were presented. Cognitive Load Theory (CLT) had a prominent place. I couldn’t help tweeting some critical comments about CLT (a good summary here, a newer interesting blog on the measure used here). For example the ‘translation’ of research that a lower cognitive load is better: of course not, you wouldn’t learn anything. Or the often used measurement instrument:

Or the role of schemas: germane load was an (unfalsifiable) attempt at explaining schemas within the CLT framework but apparently some have abandoned it because of the unfalsifiable nature. But then what? And what does it add to existing information processing theories.

The final session was by Professor Rob Coe. He talked about several things pertaining to ‘what works’. He talked about Randomised Controlled Trials, logic, and took us back to last year’s ResearchEd, Dylan Wiliam’s talk.

I am with Coe here. Rob mentioned a little cited paper that sounded very interesting.

Tom Bennett finished the day. In the North Star it was great to meet a whole range of Twitterati, It was an interesting day and professionally I hope practitioners and researchers (Primary, Secondary Education and Higher Education) can grow towards each other:

Oh, and let me end on a contrarian note: some people have got to read up on all that cognitive psychology: most researchers are for more nuanced in their papers 😉


Categories
Education Education Research

Journalclub at ResearchED

I think it’s a great idea to study articles in a journalclub setting. I read the article as well and made the following annotations:

See file attached to this message

File: 00220671%2E2013%2E807491 – annotated.pdf

Annotation summary:

— Page 2 —

Seems to me to be quite a limited view of Academic Performance, including only reading.

Must keep in mind: 2000 data. Unfortunately it is quite normal to use ‘older’ data. Some of the delay lies in publication mechanisms so PISA 2012 data released December 2013 is difficult but there are other instances.

I think multilevel analysis is useful but not everyone would agree.

PISA, so contextual effects. Differences countries?

— Page 4 —

Would be good to compare with TIMSS and PIRLS.

This is the ‘standard’ PISA sampling strategy.

I’m not sure if it already was the case for PISA 2000 but now most large-scale assessments need to take into account the complex sampling design. This means sampling WEIGHTS (because of non-response) and so-called PLAUSIBLE VALUES (because not all students make all test items). There is no mention if this in the paper so either PISA 2000 was done differently or they just ‘forgot’.

According to some (e.g. Willms) this is an appropriate substitute for the actual sampling design.

— Page 5 —

In general I would want more transparency regarding missing data and the ‘model building’, see Dedrick et al. (2009) for recommendations.

— Page 6 —

With large N results will be significant very quickly. Often ‘effect size’ is mentioned.

But see how much more is explained over the models: not much more, it seems.

— Page 7 —

So only the first PLAUSIBLE VALUE was used.

Not much ‘variance explained’

— Page 8 —

Stop with ‘thus’

— Page 9 —

Cognitive Load anyone?

Important: cause and effect

So this ‘significant’ marginally interesting because of large N.

Categories
Education Research

Some work presented in the last months

snaSome work was presented in the last months.

At Sunbelt XXXV I presented this work on classroom interaction and Social Network Analysis:

At ICTMT and PME my colleague presented our work on c-books