These are the slides to the keynote I did at CADGME 2016
Keynote at CADGME 2016
These are the slides to the keynote I did at CADGME 2016
This is the presentation I gave at ICME-13:
OPPORTUNITY TO LEARN maths: A curriculum approach with timss 2011 data
Christian Bokhove
University of Southampton
Previous studies have shown that socioeconomic status (SES) and ‘opportunity to learn’ (OTL), which can be typified as ‘curriculum content covered’, are significant predictors of students’ mathematics achievement. Seeing OTL as curriculum variable, this paper explores multilevel models (students in classrooms in countries) and appropriate classroom (teacher) level variables to examine SES and OTL in relation to mathematics achievement in the 2011 Trends in International Mathematics and Science Study (TIMSS 2011), with OTL operationalised in several distinct ways. Results suggest that the combination of SES and OTL explains a considerable amount of variance at the classroom and country level, but that this is not caused by country level OTL after accounting for SES.
Full paper, slides:
Update: added a little bit on the ‘leadership’ aspect and made wording more precise.
I covered the costs of routes into teaching before. Two reports have been released, one by the Institute for Fiscal Studies (funded by the Nuffield Foundation) and one by Teach First and Education Datalab. I must say, it doesn’t seem a coincidence Teach First commissioned another report and releases it exactly on the day the IFS report is published. I can understand why because the report(s) together give the impression that: TF is expensive, has low retention (saying it is higher in year 2 is strange as the Teach First programme lasts two years), teacher do not stay on in challenging schools BUT the ones who do stay end up in leadership functions and higher salaries. Both reports are interesting reading and I applaud the transparency behind them. What was even more interesting though was the social media and press flurry around them. In this post, I’d thought it would be good to tabulate the numerous tweets and comment on several first-hand press releases.
First a blog by the Education Datalab, which led both studies. This first describes the worse retention but then makes a case for the good aspects of Teach First. Although I think these good aspects should not be undervalued I did have some questions about some of the points highlighted, including some errors.
The error concerns the reporting of the benefits. Data was not from headteachers, as stated in the blog but secondary subject leaders (see my older blog on the report in draws from). In addition, we could also present the ‘secondary ITT coordinators’ which shows higher or at least comparable perceptions of benefit, except for salaried SD.
I also wonder where the ‘much more likely to continue to work in schools in challenging circumstances’ comes from, as the report seems to say that it may be the case after 3 years but that this reversed after 5 years. There is an additional graph (Figure 4) based on Free School Meals but that also shows a shift from higher percentages of FSM towards lower percentages FSM. I think there should be genuine concerns about this, if the idea is that the disadvantaged’ are helped. In any case, the migratory patterns of trainees need further scrutiny.
Finally, the ‘seven times’ is based on data on different cohorts. The text talks about different numbers in the table, I would say it’s 4 against 25, which of course is not seven ( a minor point). The text does mention that other routes are one year less on the job market, but I agree that it is hard to account for that.
However, what I do miss is some critical reflection on the nature of these positions. Sure, there are more in leadership positions, but are they within their original MAT? Schools within MATs? Newly founded free schools? Given the objective regarding ‘disadvantaged students’ it seems there needs to be a bit more analysis before one could say that objective is reached most effectively through ‘leadership’. It certainly isn’t through teaching as the IFS report already established that less were teaching. The establishment of charities seems a less convincing cause of reduced inequality. Given the difficulty to get school leaders I can see a place for this, by the way, but we should ask whether the much larger investment of public funds is worth the developed leadership AND whether it really ends up helping the disadvantaged. I, for one, have always said that not a lot of pressure comes out of Teach First to argue for systemic actions to address poverty and inequality. Also, the argument that TF-ers would otherwise would not have gone into education could be cynically parried by “and 60-70% doesn’t because they go to other pastures”. Is the return of investment really worth it, just looking at the expense? (And not an, in my view, emotive argument that they are such fine teachers).
Of course Teach First also had their own series of press releases. Understandably they liked to stress the ‘leadership’ aspect more than cost and retention. But they also had a post asking for more investment in research into teaching training routes. I thought the press release was a bit too defensive, to be honest. It starts off with basically saying that the comparison had not been fair, in my view surprising because previously -when the IFS had used an in my view strange way to calculate Teach First’s larger benefits– there had been no complaints about that. Towards the end it actually is repeated.
It is important to first say that I agree that more transparency of these costs and benefits is needed over the board. Of course part of the transparency is supplied by the report. Nevertheless, there still might be information that is unknown (for example, upfront I personally was wondering what part of the cost actually was covered by third party donations) and we need to realise that. The text then goes on to emphasise the ‘leadership benefits’ and again suggest it had ‘not been a fair comparison’ without actually explaining why. One aspect, it seems, concerns long term teacher quality. Although I agree with that statement, it seems a bit strange to first explain what the study did *not* study nor was asked to study. I have no doubt that Teach First provides a good quality provision, yet it needs to be off-set against the cost, just like any provision. I do know that ‘good’ and ‘outstanding’ are relatively unhelpful notions to describe, as most provisions *must* have level 3 and 4 trainees to survive (as far as I know).
Finally, then, the findings of the IFS report are addressed. I think saying the programme’ is ‘three years’ (by including recruitment) is a bit strange. Initially there were some thoughts that previous calculations did not take into account the fact that an TF or SD trainee would immediately teach in the first year, but on page 19 it is clear this has been accounted for.
Of course it is true that TF trainees do more than just PGCE and QTS, namely ‘leadership’, and that within the teachers that stay do so effectively, but I’m not sure if that is the core aim of such a programme.
The second point regarding recruitment costs seems fair, but needs to be said that TF asks schools for a recruitment fee as well. SD fees were also taken into but are much lower. I don’t think HEI fees were included but would expect that they would be lower as well, as universities can make use of extensive PR departments any way. Overall, though this might lower the total cost (see later on).
Another point made concerned the donations.
It is correct to say this is ‘not cost for the taxpayer’ of course, although it does make sense to look at all costs to evaluate the ‘value for money’. After all, if we would state that TF produces better outcomes then this might be caused by more money being pumped into their trainees.Looking again at the net funding:
It is sensible to ask what of that *is* public and what is not. Looking at those direct grants from the NCTL we can look at the year reports and conclude that Teach First received around £ 40 million in 2014-2015 to cater for 1685 trainees which is around 24k per trainee (actually, the 13-14 data was £ 34 million against 1426, about similar).
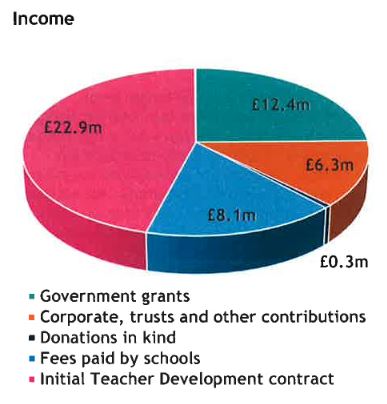
If we now also take into the direct costs to school, the upfront recruitment fee of 4k then it seems that the ‘voluntary contribution per trainee’ is rather low. Of course what is difficult is to unpick what money is actually used internally for what, so let’s also look at the total income of Teach First for 13-14 and 14-15 respectively (this is the 2014-2015 year report for Teach First):
Simply dividing the total ‘Corporate, trusts and other contributions’ by the total number of new trainees per year yields an amount of £4400-£4800. Of course not all of that might go towards training. According to the online appendices to the first report voluntary contributions for Teach First are £ 1200. Off-setting all of this against aforementioned costs they make a difference but even if we would subtract all the donations and recruitment fees, the costs stay high. I would even say it’s a bit disingenuous to focus attention on these cost types, as it suggests the work is poor (although readily cited in places where the outcome seems more favourable). The cost must be discussed, not downplayed. The last point of the Teach First press release concerns the bursaries. This, of course, is a valid point from the viewpoint of the student. I think the absurdly high costs of the bursary programmes certainly need to be taken into account. But these bursaries are not ‘cost of the programme’ rather a stimulus for individuals. I think that money can be better spent to attract teachers.
The press release finishes with:
It is interesting that Teach First uses ‘four years’ because as mentioned previously the IFS reports seems to indicate that it has changed after 5 years. The last point is a variation of incorrect reporting mentioned previously, namely that schools mentioned the benefit; they didn’t they were subject specialist and ITT coordinators in the schools gave a different picture. In an older blog I already criticised the emphasis on ‘value of benefit’ in the 2014 report.
After reading all these sources I would say:
I think Teach First is a valuable route into teaching with passionate leadership and alumni ambassadors (important: criticising cost is not criticising individuals), but it is important to evaluate the overall cost of such a programme (per trainee). Certainly in a time where both provider-led teacher training and school direct programmes have to train with vastly smaller amounts of money (for example 9k for HEI but they normally pay part of this to schools for mentoring), it is realistic to look at ‘added value’ for education. Maybe that is ‘leadership’. Maybe that’s ‘helping the disadvantaged’. But even if we think those need to be addressed it doesn’t help if retention is low and teachers end up in better schools. Rather than say ‘not a fair comparison’ it would be best to address these aspects head on.
This is a follow-up post from this post in which I unpicked one part of large education review. In that post I covered aspects of papers by Vardardottir, Kim, Wang and Duflo. In this post I cover another papers in that section (page 201).
Booij, A.S., E. Leuven en H. Oosterbeek, 2015, Ability Peer Effects in University: Evidencefrom a Randomized Experiment, IZA Discussion Paper 8769.
This is roughly the same as what is described in the article on page 20. The paper then also addresses average grade and dropout. Actually, the paper goes into many more things (teachers, for example) which I will not cover. It is interesting to look at the conclusions, and especially the abstract. I think the abstract follows from the data, although I would not have said “students of low and medium ability gain on average 0.2 SD units of achievement from switching from ability mixing to three-way tracking.” because it seems 0.20 and 0.18 respectively (so 19% as mentioned in the main body text). Only a minor quibble, which after querying, I heard has been changed in the final version. I found the discussion very limited. It is noted that in different contexts (Duflo, Carrell) roughly similar results are obtained (but see my notes on Duflo).
Overall, I find this an interesting paper which does what it says on the tin (bar some tiny comments). Together with my previous comments, though, I would still be weary about the specific contexts.
This paper has the title “Is traditional teaching really all that bad?” and is by Schwerdt and Wuppermann makes clear that this paper sets out to show it isn’t. And without this paper I would have said the same thing. Simply because I wouldn’t deny that ‘direct instruction’ has had a rough treatment in the last decades.
There are several versions of this paper on SSRN and other repositories. The published version is from ‘Economics of Education Reviw’, and this immediately shows why I have included it. In the advent of economics papers some have preferred to use this paper rather than a more sociological, psychological or education research approach.
The literature review is, as often the case in my opinion in economics papers, a bit shallow. The study uses TIMSS 2003 year 8 data (I don’t know why they didn’t use 2007 data).
I find the wording “We standardize the test scores for each subject to be mean 0 and standard deviation 1.” a bit strange because the TIMSS dataset, as in later years, does not really have ‘test scores per subject’ because subjects do not make all the assessment items.
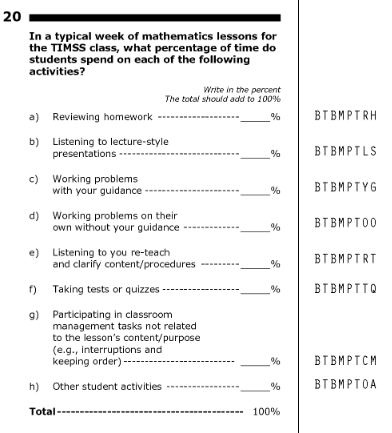
(link)Instead, there are five so-called ‘plausible values’. Not using them might underestimate the standard error, which might lead to results being significant more swiftly. This variable is the outcome, another variable is the question 20.
The distinction between instruction and problem solving are based on three of these items: b is seen as direct instruction, c and d together problem solving (note that one of course does mention ‘guidance’). There is an emphasis on ‘new material’ so I can see why these are chosen. Of course the use of percentages means that an absolute norm is not apparent, but I can see how lecture%/(lecture%+problemsolving%) denotes a ratio of lecturing. The other five elements are together used as control. Mean imputation was used (I can agree that imputation method probably did not make a difference) and sample weights (also good, contrary to no plausible values).
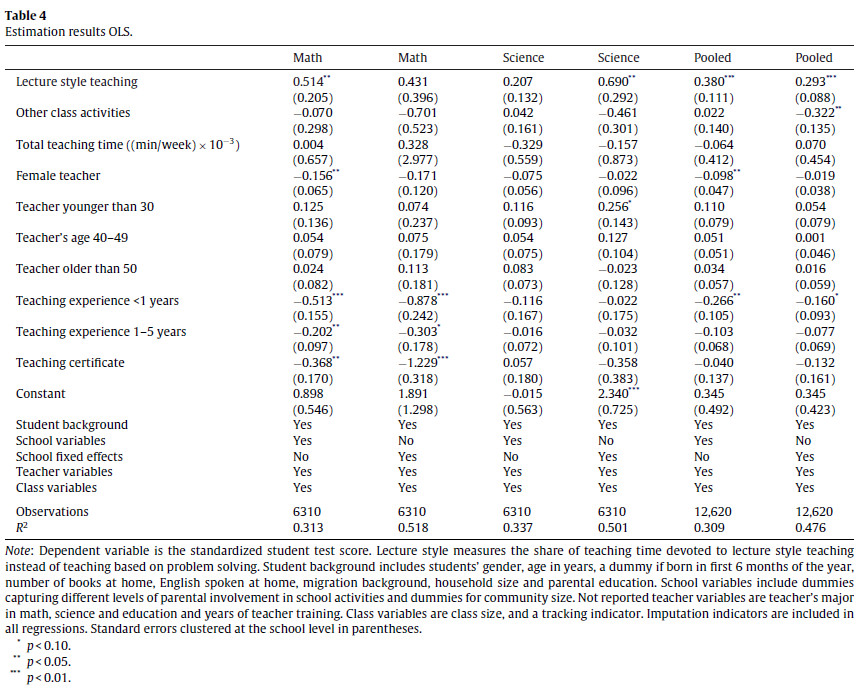
Table 1 in the paper tabulates all the variables and shows some differences between maths and science teachers, for example in the intensity of lecture style teaching. The paper then proposes a model “standard education production function”. In all the result tables we can certainly see the standard p=.10 and again with large N’s this, to me, seems unreasonable. A key result is in Table 4:
The first line is the lecture style teaching variable. Columns 1 and 3 show that Math is significant (but keep in mind, at 5% with high N. However, 0.514 does sound quite high) and Science is not. Columns 2 and 4 then have the same result but now by taking into account school sorting based on unobservable characteristics of students through inclusion of fixed school effects. I find the pooling a bit strange, and reminds me of the EEF pooling of maths mastery for primary and secondary to gain statistically significant results. Yes, here too, both subjects then yield significant results. Together with the plausible values issue I would be cautious.
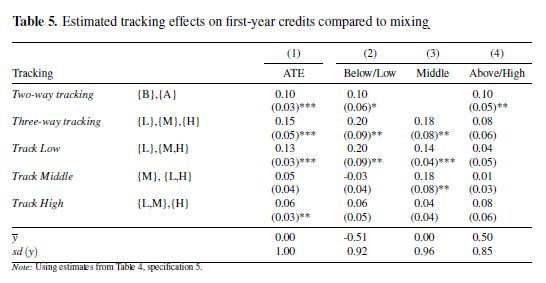
Table 5 extends the analysis.
The same pattern arises. The key variable is significant at the questionable 10% level (column 1) and a bit stronger after adding confounding variables (at the 5% level, but again with high N). The articles notices that over the columns the variable is quite constant, but also that it’s lower than the Table 4 results, showing that there are school effects.
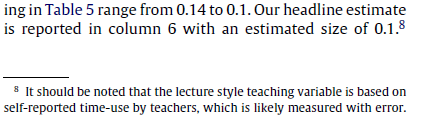
There is footnote on page 373 that might have received a bit more attention. I find the reporting a bit strange because the first line indicates that variable ranges from 0.11 to 0.14, not 0.14 to 0.1 (and why go from a larger to a smaller number, is this a typo?). Overall, 1% of an SD seems very low. I think the discussion that follows is interesting and adds some thoughts. I thought it was interesting that was said “Our results, therefore, do not call for more lecture style teaching in general. The results rather imply that simply reducing the amount of lecture style teaching and substituting it with more in-class problem solving without concern for how this is implemented is unlikely to raise overall student achievement in math and science.”. Well, that does seem a balanced conclusion, indeed. And again, a strong feature for most economic papers, the robustness checks are good.
In conclusion, I found this an interesting use of a TIMSS variable. Perhaps it could be repeated with 2011 data, and now include all five plausible values (perhaps a source of error). Nevertheless, although I think strong conclusions in favour of lecturing could be debated, likewise it could be said that there also are no negative effects of it: there’s nothing wrong with lecturing!
One of the papers that made a viral appearance on Twitter is a paper on behaviour in the classroom. Maybe it’s because of the heightened interest in behaviour, for example demonstrated in the DfE’s appointment of Tom Bennett, and behaviour having a prominent place in the Carter Review.
Carrell, S E, M Hoekstra and E Kuka (2016) “The long-run effects of disruptive peers”, NBER Working Paper 22042. link.
The paper contends how misbehaviour (actually, domestic violence) of pupils in a classroom apparently leads to large sums of money that people will miss out of later in life. There, as always, are some contextual questions of course: the paper is about the USA, and it seems to link domestic violence with classroom behaviour. But I don’t want to focus on that, I want to focus on the main result in the abstract: “Results show that exposure to a disruptive peer in classes of 25 during elementary
school reduces earnings at age 26 by 3 to 4 percent. We estimate that differential exposure to children
linked to domestic violence explains 5 to 6 percent of the rich-poor earnings gap in our data, and that
removing one disruptive peer from a classroom for one year would raise the present discounted value
of classmates’ future earnings by $100,000.”.
It’s perfectly sensible to look at peer effects of behaviour of course, but monetising it -especially with a back of envelope calculation (actual wording in the paper!)- is on very shaky ground. The paper respectively looks at the impact on test scores (table 3), college attendance and degree attainment (table 4), and labor outcomes (table 5). The latter is also the one reported in the abstract.
There are some interesting observations here. The abstract’s result is mentioned in the paper “Estimates across columns (3) through (8) in Panel A indicate that elementary school exposure to one additional disruptive student in a class of 25 reduces earnings by between 3 and 4 percent. All estimates are significant at the 10 percent level, and all but one is significant at the 5 percent level.” The fact economists would even want to use 10% (with such a large N) is already strange to me. Even 5% is tricky with those numbers. However, the main headline in the abstract can be confirmed. But have a look at panel C. It seems there is a difference between ‘reported’ and ‘unreported’ Domestic Violence. Actually, reported DV has a (non-significant) positive effect. Where was that in the abstract? Rather than a conclusion along the lines whether DV was reported or not, the conclusion only focuses on the negative effects of *unreported* DV. I think it would be more fair to make a case for better signalling and monitoring of DV, so that negative effects of unreported DV are countered; after all, there are no negative effects on peers when reported.
It feels as if there has been an incredible surge of econometric papers in social media. Like a lot of research they sometimes are ‘pumped around’ uncritically. Sometimes it’s the media, sometimes it’s a press release from the university, sometimes it’s even the researchers themselves who seem to want a ‘soundbite’. These econometric papers are fascinating. What they often have going for them -according to me- is their strong, often novel, mathematical models (for example Difference in Differences or Regression Discontinuity Design. I also like how after presenting results there often are ‘robustness’ sections. However, they also often lack a sufficient literature overview; one that often is biased towards econometric papers (yet, it is quite ‘normal’ that disciplines cite within disciplines). Also, conclusions, in my view, lack sufficient discussion of limitations. Finally, I often find that the interpretation of the statistics is a bit ‘typical’, in that econometric papers seem to love to use significance testing (NHST) with p=.10 (yes, I know of criticisms of NHST) and try to summarize the findings in a rather ‘simplistic’ way. The latter might be caused by an unhealthy academic ‘publish or perish’ culture in which we sometimes feel only extraordinary conclusions are worth publishing (publication bias).
Some people have asked me what I look for in such papers. In this first blog I will use some papers from a recent report of the CPB, the Netherlands Bureau for Economic Policy Analysis. They recently released a report on education policy, summarizing the effectiveness of all kinds of educational policies. As the media loved to quote on a section on ability grouping, who seemed to say that ‘selection worked’, I focused on that part. It also was the topic of a panel discussion at researchEd maths and science, so it also was something I had looked into any way. The research is mixed. It struck me that, as could be expected from an economic policy unit, the studies were almost all economically oriented. Of course some went as far as suggesting that the review just had high standards and that maybe therefore educational and sociological research did not make the cut (because of inclusion criteria, see p. 330 of the report, in Dutch). This all-too positive view of economic research, and less so of other research, in my view is unwarranted. It has more to do with traditions within disciplines. In this case I want to tabulate some of my thoughts about the papers around ability grouping within one type of education (p. 200 of the report). I won’t go into the specifics of the Dutch education system but it suffices to say that the Netherlands has several ‘streams’ based on ability, but within the streams students are often grouped by mixed ability. This section wanted to look at studies that looked at ability grouping within each of those streams. The media certainly made it that way.
The study that I recognized, as it featured in the Education Endowment Fund toolkit, was the paper by Duflo et al. It is a study of primary schools in Kenya.
Duflo, E., P. Dupas en M. Kremer, 2011, Peer effects, teacher incentives, and the impact of tracking: evidence from a randomized evaluation in Kenya, American Economic Review, vol. 101(5): 1739-1774.
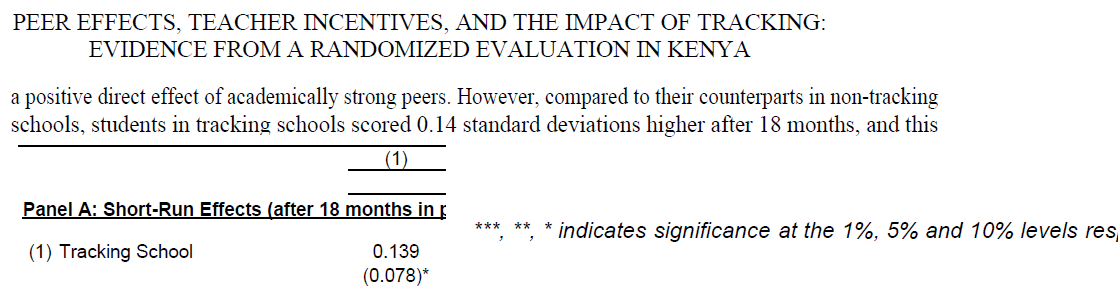
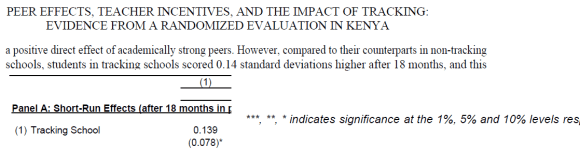
The paper first had been published as an NBER working paper. There is a difference in the wording of the abstracts of working and published paper, but in both cases the main effect is:
In sum, I think we would need to be a bit careful in concluding ‘ability grouping’ works.
Interestingly, Vardardottir points out the non-significant findings of Duflo et al., although in a preliminary paper there was a bit more discussion about the original Duflo et al. working paper. Maybe this is about different results, but I thought it was poignant.
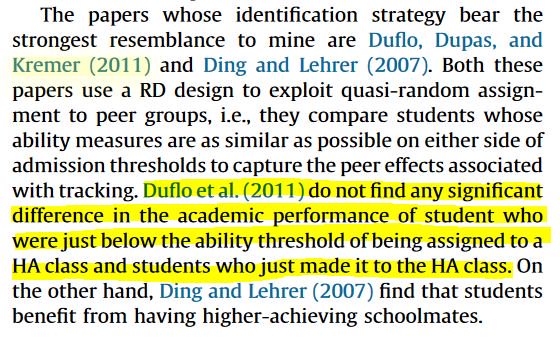
The study, conducted in Iceland and in secondary school (16 yr olds) finds “Being assigned to a high-ability class increases academic achievement”. I thought there was a lot of agreement between the data and the findings. The study is about ‘high ability classes’ and the CPB report says exactly that. This seems to correspond with educational research reviews as well: the top end of ability might profit from being in a separate ability group. However, a conclusion about ability grouping ‘in general’ for all ability groups is difficult to make here.
Vardardottir, A., 2013, Peer effects and academic achievement: A regression discontinuity approach, Economics of Education Review, vol. 36: 108-121.
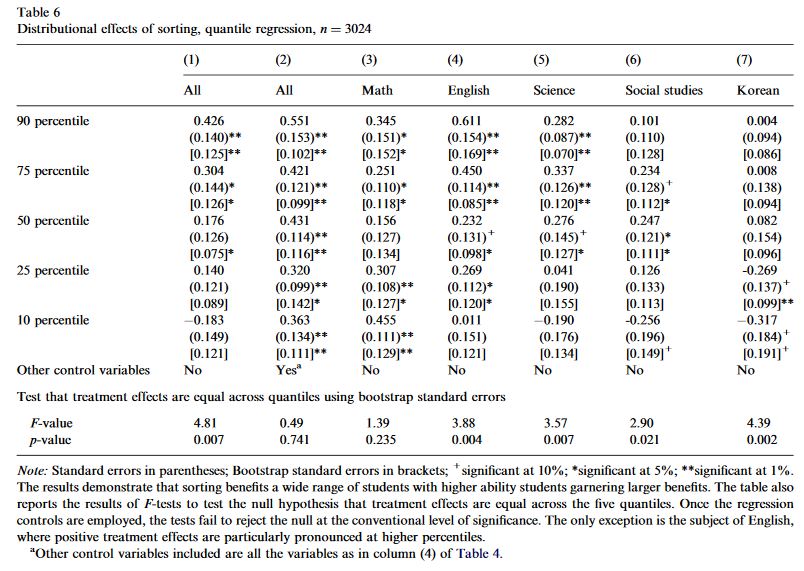
A third paper mentioned in the report is one by Kim et al.. Another context: secondary school, and one set in South Korea. It concludes that: “First, sorting raises test scores of students outside the EP areas by roughly 0.3 standard deviations, relative to mixing. Second, more surprisingly, quantile regression results reveal that sorting helps students above the median in the ability distribution, and does no harm to those below the median.”. As an aside, it’s interesting to see that the paper had already been on SSRN (now bought by Elsevier) since 2003. This begs the question, of course, from what year the data is. This always is a challenge; peer review takes time and often papers concern situations from many years before. In the meantime things (including policies) might have changed.
Kim, T., J.-H. Lee en Y. Lee, 2008, Mixing versus sorting in schooling: Evidence from the equalization policy in South Korea, Economics of Education Review, vol. 27(6): 697-711.
The paper uses ‘Difference-in-Differences’ techniques. I think the overall effect (the first conclusion), based on this approach is quite clear. I personally don’t find this very surprising (yet) as most literature tends to confirm that positive effect. However, criticism to it often is along the lines of equity i.e. like Vardardottir high ability profiting most from this, with lower ability not profiting or being even worse off. Interestingly (the authors also say ‘surprisingly’), the quantile regression seems to go into that:
The footnote summarizes the findings. If I understand correctly, the argument is that with controls, column (2) gives the overall effect per quantile of the ability grouping. This is clear: at 1% significant effects for all groups. The F-value at the bottom tests for significant differences, and is not significant (>.1, yes economists use 10%), hence the statement ‘no significant differences’ between different abilities. Based on column (2) one could say that; we could of course also say that a difference of .320SD versus .551SD is rather large. But what’s more interesting, is the pattern of significant effects over the subjects: those are all over the place in two ways. Firstly, in the differential effects on the different ability groups e.g. in English significantly larger positive effects higher ability than lower ability (just look at the number of *), in Korean significantly more negative effects for lower ability. (Note, that I did see that other control variables weren’t included here, I don’t know why, there is something interesting going on here any way, as there are differences first in column (1) but controls in (2) make them non-significant). Furthermore, the F-values at the bottom show that only for maths there are no significant differences, for all the other subjects there are, some quite sizable. What seems to be happening here is that all the positive and negative effects over the ability groups roughly cancel each other out, yielding no significant difference. Maybe they go away when including controls, but that can’t be checked. What is clear, I think, is that there are differences between subjects. I think the conclusion in the abstract “sorting helps students above the median in the ability distribution, and does no harm to those below the median” therefore needs further nuance.
Therefore it was useful there was a follow-up article by Wang. One thing addressed here is the amount of tutoring: an example of how different disciplines could complement each other i.e. Bray’s work on Shadow Education.
Wang, L. C., 2014, All work and no play? The effects of ability sorting on students’ non-school inputs, time use, and grade anxiety, Economics of Education Review, vol. 44: 29-41.
The article is, however, according to the CPB report premised on the assumption that there are null effects on lower-than-average-ability. Effects that, in my view, already deserve nuance based on subject differences. It therefore is very interesting that Wang looks at tutoring, homework etc. but the article seems to not continue with subject differences. This is a shame, in my view, because from my on mathematics education background -and as stated at that researchEd maths and science panel- I can certainly see how maths might be different to languages. It would have been a good opportunity to also think about top performance of Korea in international assessments, for example. Yet the take-away message for the CPB seems to be ‘ability grouping works’.
There are more references, which I will try to unpick in future blogs. These will also include papers on teaching style, behavior etc. all education topics for which people have promoted economics papers as ‘definitive proof’. There also are multiple working papers (the report argues that because some series often end up as peer-reviewed articles any way, they might be included, like NBER and IZA papers.) which I might cover.
Nevertheless, this first set of papers, in my view, does not really warrant the conclusion ‘ability groups work’. Though to be fair, in many cases the abstracts might make you think differently. It shows that actually reading the original source material can be important. Yet, even if we assume they do say this, the justification that follows at the end of the paragraph is strange (translated): “The literature stems, among others, from secondary education and, among others, from comparable Western countries. The results point in the same direction, disregarding school type or country. That’s why we think the results can be translated to the Dutch situation.”. Really? Research from primary, secondary and higher education (that’s the Booij one). From Kenya, from Korea (with its shadow education)?
What we have here is a large variety of educational contexts, both in school type(s), years and countries, with confusing presentation of findings with, in my view, questionable p-value. OK, now I’m being facetious; I just want people to realize that every piece of research has drawbacks. They need to be acknowledged, just like the strong(er) points. If we see quality of research as a dimension from ‘completely perfect’ (would be hard-pressed to find that) and ‘completely imperfect’, there are many many shades in-between. ‘Randomized’ is often seen as a gold standard (I still feel that this also comes with issues but that is for another blog), yet economists have deemed all kinds of fine statistical techniques as ‘quasi experimental’ and therefore ‘still good enough’. Yet, towards other disciplines there sometimes seems to be a ‘rigor’ arrogance. Likewise, other disciplines too readily dismiss some sound economics research because it seldom concerns primary data collection or they ‘summarize’ data incorrectly. It almost feels like a clash of the paradigms. I would say it depends on what you want to find out (research questions). The research questions need to be commensurate with your methodology, and they in turn both need to fit the (extent of) the conclusions. We can learn a lot from each other, and I would encourage disciplines to work together, rather than play ‘we are rigorous and you are not’ or ‘your models are crap’ games. Be critical of both (as I am above, note I’m just as critical about any piece of research without disregarding its strengths), be open to affordances of both (and more disciplines of course), and let’s work together more.
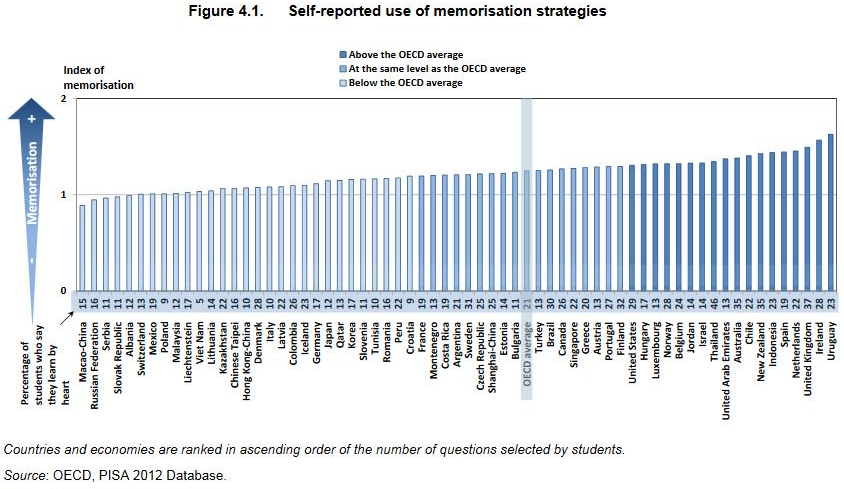
Presentation for researchED maths and science on June 11th 2016.
References at the end (might be some extra references from slides that were removed later on, this interesting 🙂
Interested in discussing, contact me at C.Bokhove@soton.ac.uk or on Twitter @cbokhove
Dit is de researchED presentatie die ik gaf op 30 Januari 2016 in Amsterdam. Enkele Engelstalige woorden zijn er in gelaten. Literatuur is aan het einde toegevoegd.
Bowie has passed away.
I did not like all his music. I was brought up with Let’s dance and the (wonderful) This is not America (from The Falcon and the Snowman, if I recall correctly). He also had a mediocre Drum & Bass outing.
My favorite band in my younger years was Suede. They were heavily influenced by Bowie. They made me look into Bowie’s Berlin period, which to me still is his best period. That and Ziggy Stardust.
I did not like all the newer stuff.
Bowie had the biggest influence on me with just one of his films (yes, of course we watched Labyrinth with the kids): Merry Christmas Mr. Lawrence. An impressive movie with similarly impressive music. The butterfly on his face will never be forgotten. This is the famous ‘kiss’ scene: