Introduction
It feels as if there has been an incredible surge of econometric papers in social media. Like a lot of research they sometimes are ‘pumped around’ uncritically. Sometimes it’s the media, sometimes it’s a press release from the university, sometimes it’s even the researchers themselves who seem to want a ‘soundbite’. These econometric papers are fascinating. What they often have going for them -according to me- is their strong, often novel, mathematical models (for example Difference in Differences or Regression Discontinuity Design. I also like how after presenting results there often are ‘robustness’ sections. However, they also often lack a sufficient literature overview; one that often is biased towards econometric papers (yet, it is quite ‘normal’ that disciplines cite within disciplines). Also, conclusions, in my view, lack sufficient discussion of limitations. Finally, I often find that the interpretation of the statistics is a bit ‘typical’, in that econometric papers seem to love to use significance testing (NHST) with p=.10 (yes, I know of criticisms of NHST) and try to summarize the findings in a rather ‘simplistic’ way. The latter might be caused by an unhealthy academic ‘publish or perish’ culture in which we sometimes feel only extraordinary conclusions are worth publishing (publication bias).
Unpicking some economics papers
Some people have asked me what I look for in such papers. In this first blog I will use some papers from a recent report of the CPB, the Netherlands Bureau for Economic Policy Analysis. They recently released a report on education policy, summarizing the effectiveness of all kinds of educational policies. As the media loved to quote on a section on ability grouping, who seemed to say that ‘selection worked’, I focused on that part. It also was the topic of a panel discussion at researchEd maths and science, so it also was something I had looked into any way. The research is mixed. It struck me that, as could be expected from an economic policy unit, the studies were almost all economically oriented. Of course some went as far as suggesting that the review just had high standards and that maybe therefore educational and sociological research did not make the cut (because of inclusion criteria, see p. 330 of the report, in Dutch). This all-too positive view of economic research, and less so of other research, in my view is unwarranted. It has more to do with traditions within disciplines. In this case I want to tabulate some of my thoughts about the papers around ability grouping within one type of education (p. 200 of the report). I won’t go into the specifics of the Dutch education system but it suffices to say that the Netherlands has several ‘streams’ based on ability, but within the streams students are often grouped by mixed ability. This section wanted to look at studies that looked at ability grouping within each of those streams. The media certainly made it that way.
Duflo et al
The study that I recognized, as it featured in the Education Endowment Fund toolkit, was the paper by Duflo et al. It is a study of primary schools in Kenya.
Duflo, E., P. Dupas en M. Kremer, 2011, Peer effects, teacher incentives, and the impact of tracking: evidence from a randomized evaluation in Kenya, American Economic Review, vol. 101(5): 1739-1774.
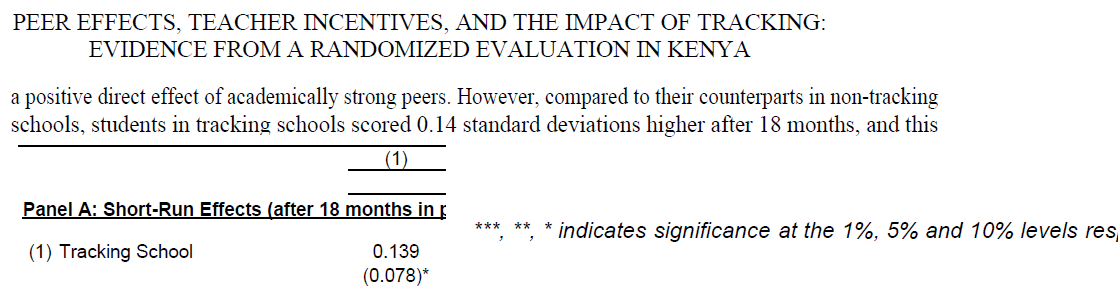
The paper first had been published as an NBER working paper. There is a difference in the wording of the abstracts of working and published paper, but in both cases the main effect is:
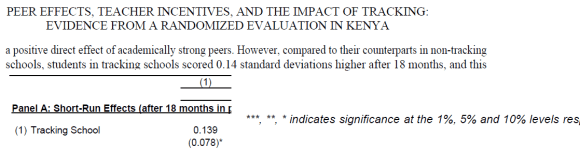
- Tracking schools scored 0.14SD higher.
- The result comes from Table 2.
- But the paper uses 10% significance level to get a significant result. N is large, although number schools -not mentioned in the table- lower.
- Long-run effects seem stronger but it would be hard to argue nothing else could have influenced this.
In sum, I think we would need to be a bit careful in concluding ‘ability grouping’ works.
Vardardottir
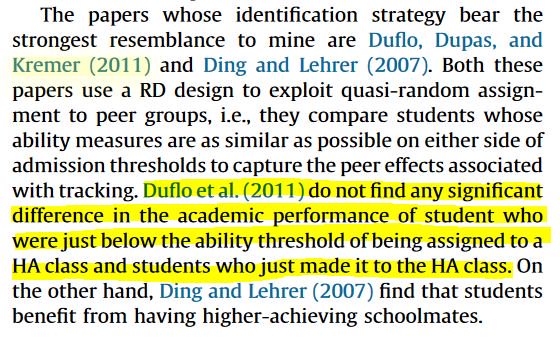
Interestingly, Vardardottir points out the non-significant findings of Duflo et al., although in a preliminary paper there was a bit more discussion about the original Duflo et al. working paper. Maybe this is about different results, but I thought it was poignant.
 The study, conducted in Iceland and in secondary school (16 yr olds) finds “Being assigned to a high-ability class increases academic achievement”. I thought there was a lot of agreement between the data and the findings. The study is about ‘high ability classes’ and the CPB report says exactly that. This seems to correspond with educational research reviews as well: the top end of ability might profit from being in a separate ability group. However, a conclusion about ability grouping ‘in general’ for all ability groups is difficult to make here.
Vardardottir, A., 2013, Peer effects and academic achievement: A regression discontinuity approach, Economics of Education Review, vol. 36: 108-121.
Kim et al and Wang
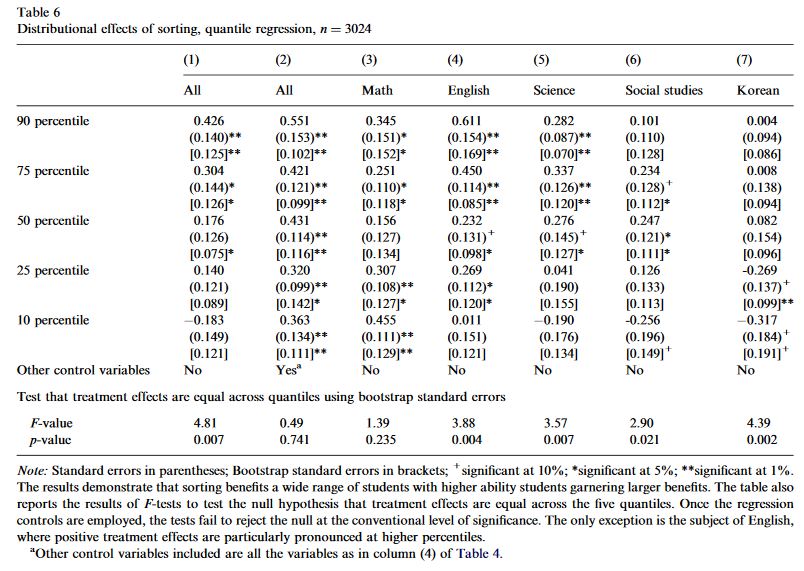
A third paper mentioned in the report is one by Kim et al.. Another context: secondary school, and one set in South Korea. It concludes that: “First, sorting raises test scores of students outside the EP areas by roughly 0.3 standard deviations, relative to mixing. Second, more surprisingly, quantile regression results reveal that sorting helps students above the median in the ability distribution, and does no harm to those below the median.”. As an aside, it’s interesting to see that the paper had already been on SSRN (now bought by Elsevier) since 2003. This begs the question, of course, from what year the data is. This always is a challenge; peer review takes time and often papers concern situations from many years before. In the meantime things (including policies) might have changed.
Kim, T., J.-H. Lee en Y. Lee, 2008, Mixing versus sorting in schooling: Evidence from the equalization policy in South Korea, Economics of Education Review, vol. 27(6): 697-711.
The paper uses ‘Difference-in-Differences’ techniques. I think the overall effect (the first conclusion), based on this approach is quite clear. I personally don’t find this very surprising (yet) as most literature tends to confirm that positive effect. However, criticism to it often is along the lines of equity i.e. like Vardardottir high ability profiting most from this, with lower ability not profiting or being even worse off. Interestingly (the authors also say ‘surprisingly’), the quantile regression seems to go into that:
 The footnote summarizes the findings. If I understand correctly, the argument is that with controls, column (2) gives the overall effect per quantile of the ability grouping. This is clear: at 1% significant effects for all groups. The F-value at the bottom tests for significant differences, and is not significant (>.1, yes economists use 10%), hence the statement ‘no significant differences’ between different abilities. Based on column (2) one could say that; we could of course also say that a difference of .320SD versus .551SD is rather large. But what’s more interesting, is the pattern of significant effects over the subjects: those are all over the place in two ways. Firstly, in the differential effects on the different ability groups e.g. in English significantly larger positive effects higher ability than lower ability (just look at the number of *), in Korean significantly more negative effects for lower ability. (Note, that I did see that other control variables weren’t included here, I don’t know why, there is something interesting going on here any way, as there are differences first in column (1) but controls in (2) make them non-significant). Furthermore, the F-values at the bottom show that only for maths there are no significant differences, for all the other subjects there are, some quite sizable. What seems to be happening here is that all the positive and negative effects over the ability groups roughly cancel each other out, yielding no significant difference. Maybe they go away when including controls, but that can’t be checked. What is clear, I think, is that there are differences between subjects. I think the conclusion in the abstract “sorting helps students above the median in the ability distribution, and does no harm to those below the median” therefore needs further nuance.
Therefore it was useful there was a follow-up article by Wang. One thing addressed here is the amount of tutoring: an example of how different disciplines could complement each other i.e. Bray’s work on Shadow Education.
Wang, L. C., 2014, All work and no play? The effects of ability sorting on students’ non-school inputs, time use, and grade anxiety, Economics of Education Review, vol. 44: 29-41.
The article is, however, according to the CPB report premised on the assumption that there are null effects on lower-than-average-ability. Effects that, in my view, already deserve nuance based on subject differences. It therefore is very interesting that Wang looks at tutoring, homework etc. but the article seems to not continue with subject differences. This is a shame, in my view, because from my on mathematics education background -and as stated at that researchEd maths and science panel- I can certainly see how maths might be different to languages. It would have been a good opportunity to also think about top performance of Korea in international assessments, for example. Yet the take-away message for the CPB seems to be ‘ability grouping works’.
Conclusions not warranted?
There are more references, which I will try to unpick in future blogs. These will also include papers on teaching style, behavior etc. all education topics for which people have promoted economics papers as ‘definitive proof’. There also are multiple working papers (the report argues that because some series often end up as peer-reviewed articles any way, they might be included, like NBER and IZA papers.) which I might cover.
Nevertheless, this first set of papers, in my view, does not really warrant the conclusion ‘ability groups work’. Though to be fair, in many cases the abstracts might make you think differently. It shows that actually reading the original source material can be important. Yet, even if we assume they do say this, the justification that follows at the end of the paragraph is strange (translated): “The literature stems, among others, from secondary education and, among others, from comparable Western countries. The results point in the same direction, disregarding school type or country. That’s why we think the results can be translated to the Dutch situation.”. Really? Research from primary, secondary and higher education (that’s the Booij one). From Kenya, from Korea (with its shadow education)?
Final thoughts
What we have here is a large variety of educational contexts, both in school type(s), years and countries, with confusing presentation of findings with, in my view, questionable p-value. OK, now I’m being facetious; I just want people to realize that every piece of research has drawbacks. They need to be acknowledged, just like the strong(er) points. If we see quality of research as a dimension from ‘completely perfect’ (would be hard-pressed to find that) and ‘completely imperfect’, there are many many shades in-between. ‘Randomized’ is often seen as a gold standard (I still feel that this also comes with issues but that is for another blog), yet economists have deemed all kinds of fine statistical techniques as ‘quasi experimental’ and therefore ‘still good enough’. Yet, towards other disciplines there sometimes seems to be a ‘rigor’ arrogance. Likewise, other disciplines too readily dismiss some sound economics research because it seldom concerns primary data collection or they ‘summarize’ data incorrectly. It almost feels like a clash of the paradigms. I would say it depends on what you want to find out (research questions). The research questions need to be commensurate with your methodology, and they in turn both need to fit the (extent of) the conclusions. We can learn a lot from each other, and I would encourage disciplines to work together, rather than play ‘we are rigorous and you are not’ or ‘your models are crap’ games. Be critical of both (as I am above, note I’m just as critical about any piece of research without disregarding its strengths), be open to affordances of both (and more disciplines of course), and let’s work together more.